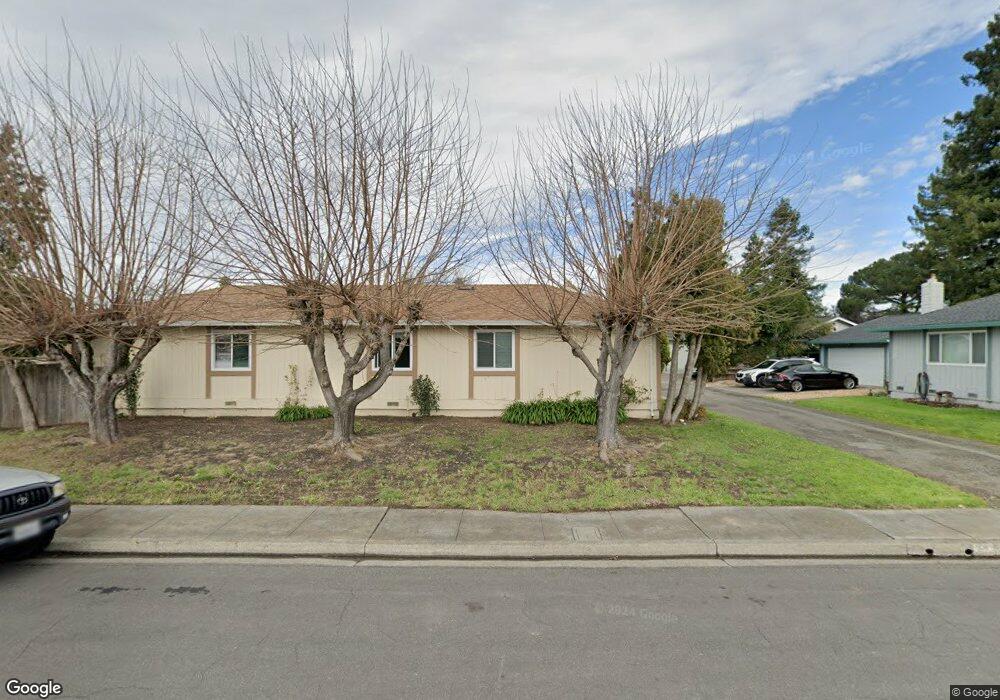
7340 Corsica Ct Rohnert Park, CA 94928
Estimated Value: $695,511 - $750,000
3
Beds
2
Baths
1,506
Sq Ft
$472/Sq Ft
Est. Value
About This Home
This home is located at 7340 Corsica Ct, Rohnert Park, CA 94928 and is currently estimated at $710,378, approximately $471 per square foot. 7340 Corsica Ct is a home located in Sonoma County with nearby schools including Rancho Cotate High School, Cross & Crown Lutheran School, and Bridghaven.
Ownership History
Date
Name
Owned For
Owner Type
Purchase Details
Closed on
Feb 3, 2010
Sold by
Morrow Jeani
Bought by
Rapp Robert W
Current Estimated Value
Home Financials for this Owner
Home Financials are based on the most recent Mortgage that was taken out on this home.
Original Mortgage
$246,453
Outstanding Balance
$164,896
Interest Rate
5.25%
Mortgage Type
FHA
Estimated Equity
$545,482
Purchase Details
Closed on
Jun 26, 2006
Sold by
Rapp Robert W
Bought by
Rapp Robert W and Morrow Jeani
Home Financials for this Owner
Home Financials are based on the most recent Mortgage that was taken out on this home.
Original Mortgage
$375,000
Interest Rate
7.99%
Mortgage Type
Balloon
Create a Home Valuation Report for This Property
The Home Valuation Report is an in-depth analysis detailing your home's value as well as a comparison with similar homes in the area
Home Values in the Area
Average Home Value in this Area
Purchase History
| Date | Buyer | Sale Price | Title Company |
|---|---|---|---|
| Rapp Robert W | -- | First American Title Company | |
| Grow Steven J | $251,000 | First American Title Company | |
| Rapp Robert W | -- | Chicago Title Co | |
| Rapp Robert W | -- | Chicago Title Company | |
| Rapp Robert W | $500,000 | Chicago Title Company |
Source: Public Records
Mortgage History
| Date | Status | Borrower | Loan Amount |
|---|---|---|---|
| Open | Grow Steven J | $246,453 | |
| Previous Owner | Rapp Robert W | $375,000 | |
| Previous Owner | Rapp Robert W | $125,000 |
Source: Public Records
Tax History Compared to Growth
Tax History
| Year | Tax Paid | Tax Assessment Tax Assessment Total Assessment is a certain percentage of the fair market value that is determined by local assessors to be the total taxable value of land and additions on the property. | Land | Improvement |
|---|---|---|---|---|
| 2025 | $3,755 | $323,981 | $154,892 | $169,089 |
| 2024 | $3,755 | $317,629 | $151,855 | $165,774 |
| 2023 | $3,755 | $311,402 | $148,878 | $162,524 |
| 2022 | $3,682 | $305,297 | $145,959 | $159,338 |
| 2021 | $3,652 | $299,312 | $143,098 | $156,214 |
| 2020 | $3,705 | $296,244 | $141,631 | $154,613 |
| 2019 | $3,657 | $290,436 | $138,854 | $151,582 |
| 2018 | $3,587 | $284,742 | $136,132 | $148,610 |
| 2017 | $3,527 | $279,160 | $133,463 | $145,697 |
| 2016 | $3,379 | $273,688 | $130,847 | $142,841 |
| 2015 | $3,298 | $269,578 | $128,882 | $140,696 |
| 2014 | $3,274 | $264,298 | $126,358 | $137,940 |
Source: Public Records
Map
Nearby Homes
- 7103 Camino Colegio Unit 55
- 746 Bernadette Ave
- 7530 Bernice Ave
- 7134 Carillon Ct
- 8140 Sunflower Dr
- 6731 Avenida Cala
- 77 Walnut Cir
- 6454 Amberwood St
- 530 Anson Ct
- 6469 Meadow Pines Ave
- 7301 Willlowglen Dr
- 7316 Willowglen Dr
- 138 Walnut Cir
- 8034 Adrian Dr
- 6440 Country Club Dr
- 7645 Camino Colegio
- 7767 Camino Colegio Unit 29
- 566 Santa Alicia Dr
- 1022 Civic Center Dr Unit 33
- 928 Civic Center Dr
- 7338 Corsica Ct
- 7346 Corsica Ct
- 7336 Corsica Ct
- 7337 Carioca Ct
- 7335 Carioca Ct
- 7339 Carioca Ct
- 7342 Corsica Ct
- 7334 Corsica Ct
- 7333 Carioca Ct
- 7332 Corsica Ct
- 7341 Carioca Ct
- 7344 Corsica Ct
- 7330 Corsica Ct
- 7331 Carioca Ct
- 7337 Corsica Ct
- 7335 Corsica Ct
- 7341 Corsica Ct
- 7333 Corsica Ct
- 7408 Circle Dr
- 7312 Circle Dr