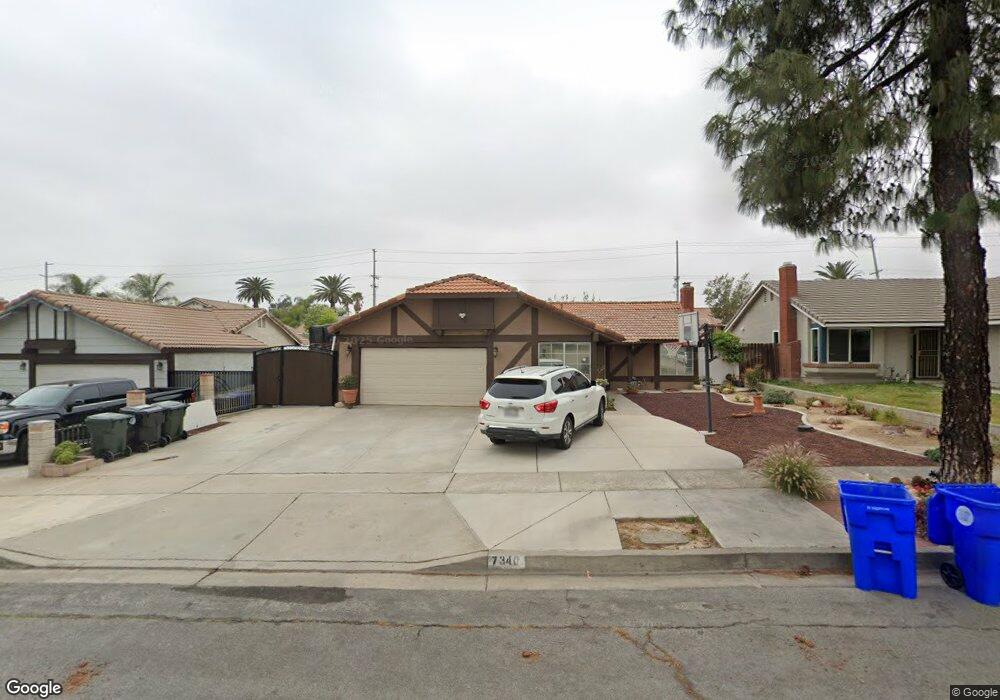
7340 Ferndale Ave Fontana, CA 92336
Estimated Value: $572,000 - $694,000
4
Beds
2
Baths
1,344
Sq Ft
$457/Sq Ft
Est. Value
About This Home
This home is located at 7340 Ferndale Ave, Fontana, CA 92336 and is currently estimated at $614,388, approximately $457 per square foot. 7340 Ferndale Ave is a home located in San Bernardino County with nearby schools including Locust Elementary School, Alder Middle School, and Fontana A. B. Miller High School.
Ownership History
Date
Name
Owned For
Owner Type
Purchase Details
Closed on
Jun 8, 2019
Sold by
Riar Yvonne
Bought by
Riar Yvonne and Riar Davinder S
Current Estimated Value
Purchase Details
Closed on
Mar 31, 2010
Sold by
Riar Davinder S
Bought by
Riar Yvonne
Home Financials for this Owner
Home Financials are based on the most recent Mortgage that was taken out on this home.
Original Mortgage
$166,429
Outstanding Balance
$109,698
Interest Rate
4.87%
Mortgage Type
FHA
Estimated Equity
$504,690
Purchase Details
Closed on
Mar 18, 2010
Sold by
Farley Jason
Bought by
Riar Yvonne
Home Financials for this Owner
Home Financials are based on the most recent Mortgage that was taken out on this home.
Original Mortgage
$166,429
Outstanding Balance
$109,698
Interest Rate
4.87%
Mortgage Type
FHA
Estimated Equity
$504,690
Purchase Details
Closed on
Mar 4, 2003
Sold by
Farley Karlyn Renee
Bought by
Farley Jason
Home Financials for this Owner
Home Financials are based on the most recent Mortgage that was taken out on this home.
Original Mortgage
$132,800
Interest Rate
5.83%
Mortgage Type
Stand Alone First
Purchase Details
Closed on
Feb 9, 2003
Sold by
Fields Joe N
Bought by
Farley Jason
Home Financials for this Owner
Home Financials are based on the most recent Mortgage that was taken out on this home.
Original Mortgage
$132,800
Interest Rate
5.83%
Mortgage Type
Stand Alone First
Purchase Details
Closed on
Sep 11, 2000
Sold by
Comer Patrick D and Comer Cindy L
Bought by
Fields Joe N
Home Financials for this Owner
Home Financials are based on the most recent Mortgage that was taken out on this home.
Original Mortgage
$135,769
Interest Rate
7.13%
Mortgage Type
FHA
Purchase Details
Closed on
May 11, 2000
Sold by
Hud
Bought by
Comer Patrick D and Comer Cindy L
Home Financials for this Owner
Home Financials are based on the most recent Mortgage that was taken out on this home.
Original Mortgage
$95,900
Interest Rate
8.2%
Purchase Details
Closed on
Mar 1, 2000
Sold by
Chase Manhattan Mtg Corp
Bought by
Hud
Purchase Details
Closed on
Jan 13, 2000
Sold by
Yanez Elizabeth
Bought by
Chase Manhattan Mtg Corp
Purchase Details
Closed on
Mar 11, 1998
Sold by
Hud
Bought by
Yanez Elizabeth
Home Financials for this Owner
Home Financials are based on the most recent Mortgage that was taken out on this home.
Original Mortgage
$87,270
Interest Rate
7.07%
Mortgage Type
FHA
Purchase Details
Closed on
Sep 11, 1997
Sold by
Dailey Michael and Dailey Shirley
Bought by
Wells Fargo Bank National Assn
Purchase Details
Closed on
Sep 4, 1997
Sold by
Wells Fargo Bank National Assn
Bought by
Hud
Create a Home Valuation Report for This Property
The Home Valuation Report is an in-depth analysis detailing your home's value as well as a comparison with similar homes in the area
Home Values in the Area
Average Home Value in this Area
Purchase History
| Date | Buyer | Sale Price | Title Company |
|---|---|---|---|
| Riar Yvonne | -- | None Available | |
| Riar Yvonne | -- | Lawyers Title | |
| Riar Yvonne | $169,500 | Lawyers Title | |
| Farley Jason | -- | Chicago Title Co | |
| Farley Jason | $166,000 | Chicago Title Co | |
| Fields Joe N | $138,000 | Lawyers Title Company | |
| Comer Patrick D | $100,000 | Lawyers Title Company | |
| Hud | -- | Landsafe Title | |
| Chase Manhattan Mtg Corp | $96,605 | Landsafe Title | |
| Yanez Elizabeth | $88,000 | American Title | |
| Wells Fargo Bank National Assn | $100,335 | American Title Ins Co | |
| Hud | -- | American Title Ins Co |
Source: Public Records
Mortgage History
| Date | Status | Borrower | Loan Amount |
|---|---|---|---|
| Open | Riar Yvonne | $166,429 | |
| Previous Owner | Farley Jason | $132,800 | |
| Previous Owner | Fields Joe N | $135,769 | |
| Previous Owner | Comer Patrick D | $95,900 | |
| Previous Owner | Yanez Elizabeth | $87,270 |
Source: Public Records
Tax History Compared to Growth
Tax History
| Year | Tax Paid | Tax Assessment Tax Assessment Total Assessment is a certain percentage of the fair market value that is determined by local assessors to be the total taxable value of land and additions on the property. | Land | Improvement |
|---|---|---|---|---|
| 2025 | $3,232 | $218,797 | $54,701 | $164,096 |
| 2024 | $3,232 | $214,506 | $53,628 | $160,878 |
| 2023 | $2,708 | $210,300 | $52,576 | $157,724 |
| 2022 | $2,679 | $206,176 | $51,545 | $154,631 |
| 2021 | $2,643 | $202,133 | $50,534 | $151,599 |
| 2020 | $2,623 | $200,061 | $50,016 | $150,045 |
| 2019 | $2,558 | $196,138 | $49,035 | $147,103 |
| 2018 | $2,569 | $192,293 | $48,074 | $144,219 |
| 2017 | $2,530 | $188,522 | $47,131 | $141,391 |
| 2016 | $2,468 | $184,826 | $46,207 | $138,619 |
| 2015 | $2,422 | $182,050 | $45,513 | $136,537 |
| 2014 | $2,408 | $178,483 | $44,621 | $133,862 |
Source: Public Records
Map
Nearby Homes
- 7724 Myles Ct
- 17571 Shamrock Ave
- 18281 Montgomery Ave
- 7398 N Maple Ave
- 17806 Terry St
- 7835 Laurel Ave
- 7740 Lombardy Ave
- 7852 Grace Ave
- 956 N Sandalwood Ave
- 7870 Williams Rd
- 17548 Court St
- 17562 Court St
- 7925 Spohn Ave
- 7936 Alder Ave
- 645 N Maple Ave
- 17848 17858 Foothill Blvd
- 8019 Alder Ave
- 7738 Encinitas Ave
- 17341 Fairfax St
- 7470 Blanchard Ave
- 7330 Ferndale Ave
- 7350 Ferndale Ave
- 7345 Laurel Ave
- 7355 Laurel Ave
- 7320 Ferndale Ave
- 7335 Laurel Ave
- 7360 Ferndale Ave
- 7345 Ferndale Ave
- 7325 Laurel Ave
- 7365 Laurel Ave
- 7355 Ferndale Ave
- 7335 Ferndale Ave
- 7310 Ferndale Ave
- 7370 Ferndale Ave
- 7365 Ferndale Ave
- 7325 Ferndale Ave
- 7315 Laurel Ave
- 7375 Laurel Ave
- 7315 Ferndale Ave
- 7300 Ferndale Ave