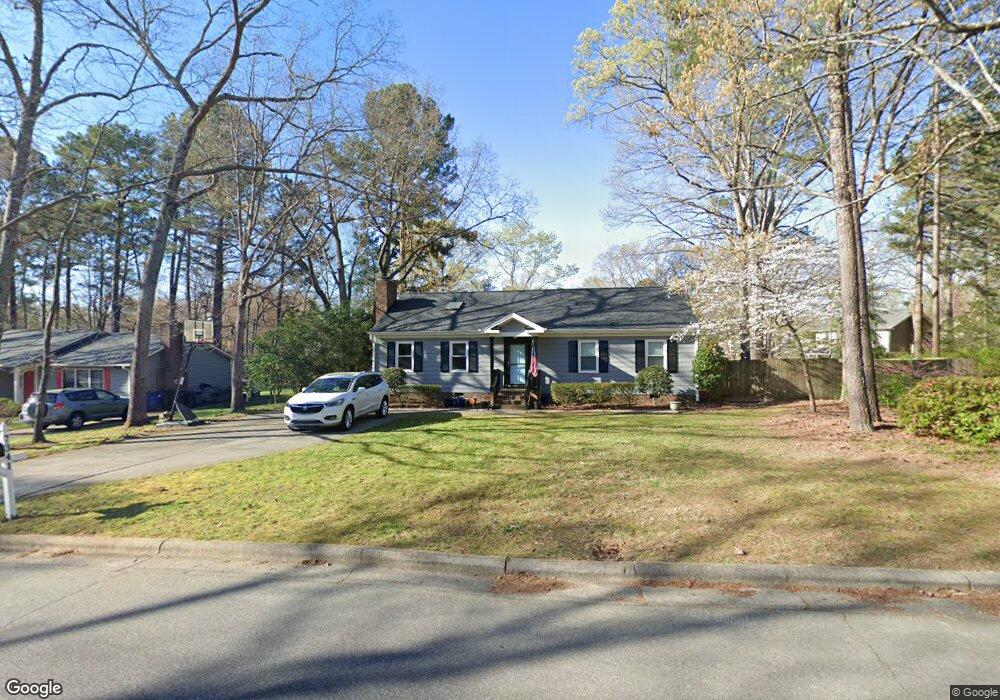
7341 Mill Ridge Rd Raleigh, NC 27613
Stonehenge NeighborhoodEstimated Value: $473,000 - $530,000
4
Beds
3
Baths
1,960
Sq Ft
$257/Sq Ft
Est. Value
About This Home
This home is located at 7341 Mill Ridge Rd, Raleigh, NC 27613 and is currently estimated at $503,872, approximately $257 per square foot. 7341 Mill Ridge Rd is a home located in Wake County with nearby schools including Jeffreys Grove Elementary School, Carroll Middle, and Sanderson High School.
Ownership History
Date
Name
Owned For
Owner Type
Purchase Details
Closed on
Mar 9, 2012
Sold by
Weber Michael and Weber Barbara
Bought by
Wheelock Erin
Current Estimated Value
Home Financials for this Owner
Home Financials are based on the most recent Mortgage that was taken out on this home.
Original Mortgage
$187,692
Outstanding Balance
$128,191
Interest Rate
3.75%
Mortgage Type
FHA
Estimated Equity
$375,681
Purchase Details
Closed on
Aug 12, 2003
Sold by
Ennis Ralph Colwell and Ennis Jennifer Heer
Bought by
Weber Michael D and Weber Barbara True
Home Financials for this Owner
Home Financials are based on the most recent Mortgage that was taken out on this home.
Original Mortgage
$140,000
Interest Rate
4.79%
Mortgage Type
Purchase Money Mortgage
Purchase Details
Closed on
May 5, 2003
Sold by
Ennis Ralph Colwell and Ennis Jennifer Heer
Bought by
Ennis Ralph Colwell and Ennis Jennifer Heer
Create a Home Valuation Report for This Property
The Home Valuation Report is an in-depth analysis detailing your home's value as well as a comparison with similar homes in the area
Home Values in the Area
Average Home Value in this Area
Purchase History
| Date | Buyer | Sale Price | Title Company |
|---|---|---|---|
| Wheelock Erin | $194,000 | None Available | |
| Weber Michael D | $175,000 | -- | |
| Ennis Ralph Colwell | -- | -- |
Source: Public Records
Mortgage History
| Date | Status | Borrower | Loan Amount |
|---|---|---|---|
| Open | Wheelock Erin | $187,692 | |
| Previous Owner | Weber Michael D | $140,000 | |
| Closed | Weber Michael D | $17,500 |
Source: Public Records
Tax History
| Year | Tax Paid | Tax Assessment Tax Assessment Total Assessment is a certain percentage of the fair market value that is determined by local assessors to be the total taxable value of land and additions on the property. | Land | Improvement |
|---|---|---|---|---|
| 2025 | $4,071 | $464,566 | $200,000 | $264,566 |
| 2024 | $3,897 | $446,366 | $200,000 | $246,366 |
| 2023 | $3,203 | $291,987 | $115,000 | $176,987 |
| 2022 | $2,976 | $291,987 | $115,000 | $176,987 |
| 2021 | $2,861 | $291,987 | $115,000 | $176,987 |
| 2020 | $2,809 | $291,987 | $115,000 | $176,987 |
| 2019 | $2,722 | $233,132 | $100,000 | $133,132 |
| 2018 | $2,567 | $233,132 | $100,000 | $133,132 |
| 2017 | $2,440 | $232,641 | $100,000 | $132,641 |
| 2016 | $2,390 | $232,641 | $100,000 | $132,641 |
| 2015 | $2,187 | $209,274 | $78,000 | $131,274 |
| 2014 | -- | $209,274 | $78,000 | $131,274 |
Source: Public Records
Map
Nearby Homes
- 6948 Three Bridges Cir
- 7741 Wilderness Rd
- 6901 Saxby Ct
- 6906 Saxby Ct
- 2605 Valley Woods Ct
- 2412 Wertherson Ln
- 2829 Seclusion Ct
- 403 Broad Leaf Cir Unit 403
- 404 Broad Leaf Cir Unit 404
- 4104 Betterton Dr
- 104 Oak Hollow Ct Unit 104
- 412 Oak Hollow Ct
- 2713 Salisbury Plain
- 6128 Chowning Ct
- 202 Oak Hollow Ct
- 7015 Gentle Pine Place
- 7009 Gentle Pine Place
- 8008 Broad St Unit 104
- 2924 Skybrook Oaks Dr
- 8116 Andrea Ln Unit 101
- 7337 Mill Ridge Rd
- 7304 Saint Ledger Dr
- 7313 Saint Ledger Dr
- 7333 Mill Ridge Rd
- 7309 St Ledger Dr
- 7340 Mill Ridge Rd
- 7309 Saint Ledger Dr
- 7336 Mill Ridge Rd
- 7400 Mill Ridge Rd
- 7305 Saint Ledger Dr
- 7332 Mill Ridge Rd
- 7405 Mill Ridge Rd
- 7404 Mill Ridge Rd
- 2824 Pidgeon Hill Rd
- 7329 Mill Ridge Rd
- 7301 Saint Ledger Dr
- 7328 Mill Ridge Rd
- 7308 Ray Rd
- 7312 Ray Rd
- 7409 Old Hundred Rd
Your Personal Tour Guide
Ask me questions while you tour the home.