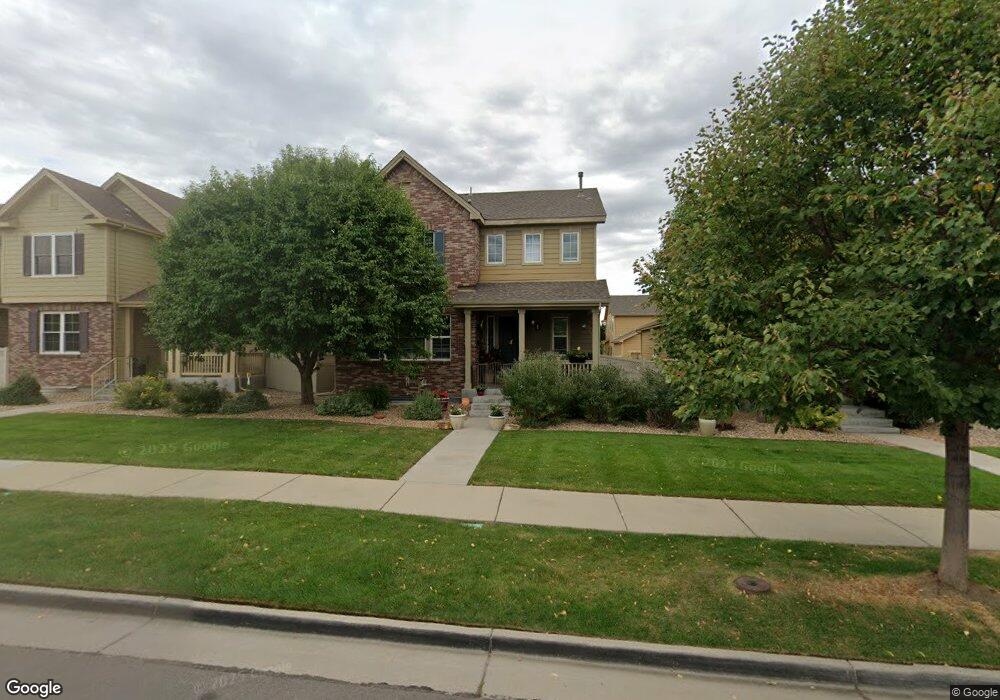
7342 Depew St Arvada, CO 80003
Shoenberg Farms NeighborhoodEstimated Value: $616,117 - $683,000
3
Beds
5
Baths
2,069
Sq Ft
$309/Sq Ft
Est. Value
About This Home
This home is located at 7342 Depew St, Arvada, CO 80003 and is currently estimated at $639,029, approximately $308 per square foot. 7342 Depew St is a home with nearby schools including Swanson Elementary School, North Arvada Middle School, and Arvada High School.
Ownership History
Date
Name
Owned For
Owner Type
Purchase Details
Closed on
May 28, 2013
Sold by
Shoenberg Farms Llc
Bought by
Wilson Chase J
Current Estimated Value
Home Financials for this Owner
Home Financials are based on the most recent Mortgage that was taken out on this home.
Original Mortgage
$217,599
Outstanding Balance
$154,373
Interest Rate
3.43%
Mortgage Type
New Conventional
Estimated Equity
$484,656
Purchase Details
Closed on
Nov 7, 2012
Sold by
High Pointe Inc
Bought by
Shoenberg Farms Llc
Purchase Details
Closed on
Jun 4, 2010
Sold by
Nvh Wip Lllp
Bought by
Arcadia Holdings At Shoenberg Famrs Llc
Purchase Details
Closed on
Dec 24, 2009
Sold by
Nvh Parent Llc
Bought by
Nvh Wip Lllp
Purchase Details
Closed on
Dec 23, 2009
Sold by
Village Homes Of Colorado Inc
Bought by
Nvh Parent Llc
Create a Home Valuation Report for This Property
The Home Valuation Report is an in-depth analysis detailing your home's value as well as a comparison with similar homes in the area
Home Values in the Area
Average Home Value in this Area
Purchase History
| Date | Buyer | Sale Price | Title Company |
|---|---|---|---|
| Wilson Chase J | $271,999 | First American | |
| Shoenberg Farms Llc | -- | None Available | |
| High Pointe Inc | -- | None Available | |
| Arcadia Holdings At Shoenberg Famrs Llc | $1,650,000 | None Available | |
| Nvh Wip Lllp | -- | Land Title Guarantee Company | |
| Nvh Parent Llc | $2,594,700 | Land Title Guarantee Company |
Source: Public Records
Mortgage History
| Date | Status | Borrower | Loan Amount |
|---|---|---|---|
| Open | Wilson Chase J | $217,599 |
Source: Public Records
Tax History
| Year | Tax Paid | Tax Assessment Tax Assessment Total Assessment is a certain percentage of the fair market value that is determined by local assessors to be the total taxable value of land and additions on the property. | Land | Improvement |
|---|---|---|---|---|
| 2024 | $3,113 | $40,883 | $7,961 | $32,922 |
| 2023 | $3,113 | $40,883 | $7,961 | $32,922 |
| 2022 | $2,633 | $33,861 | $7,413 | $26,448 |
| 2021 | $2,672 | $34,835 | $7,626 | $27,209 |
| 2020 | $2,599 | $34,084 | $8,903 | $25,181 |
| 2019 | $2,558 | $34,084 | $8,903 | $25,181 |
| 2018 | $2,015 | $25,959 | $5,353 | $20,606 |
| 2017 | $1,804 | $25,959 | $5,353 | $20,606 |
| 2016 | $1,908 | $25,469 | $4,861 | $20,608 |
| 2015 | $1,664 | $25,469 | $4,861 | $20,608 |
| 2014 | $1,664 | $20,712 | $4,123 | $16,589 |
Source: Public Records
Map
Nearby Homes
- 5580 W 73rd Ave
- 5549 W 72nd Place
- 7414 Benton St
- 7586 Chase St
- 5341 W 76th Ave Unit 213
- 5301 W 76th Ave Unit 114
- 7656 Depew St Unit 103
- 7624 Gray Way
- 5321 W 76th Ave Unit 322
- 5670 W 71st Ave
- 7680 Depew St Unit 1424
- 5720 W 71st Ave
- 5724 W 71st Ave
- 5565 W 76th Ave Unit 1204
- 7495 Kendall St
- 5024 W 70th Ct
- 7474 Kendall St
- 6317 W 71st Ave
- 4910 W 73rd Ave
- 4839 W 73rd Ave Unit 4839