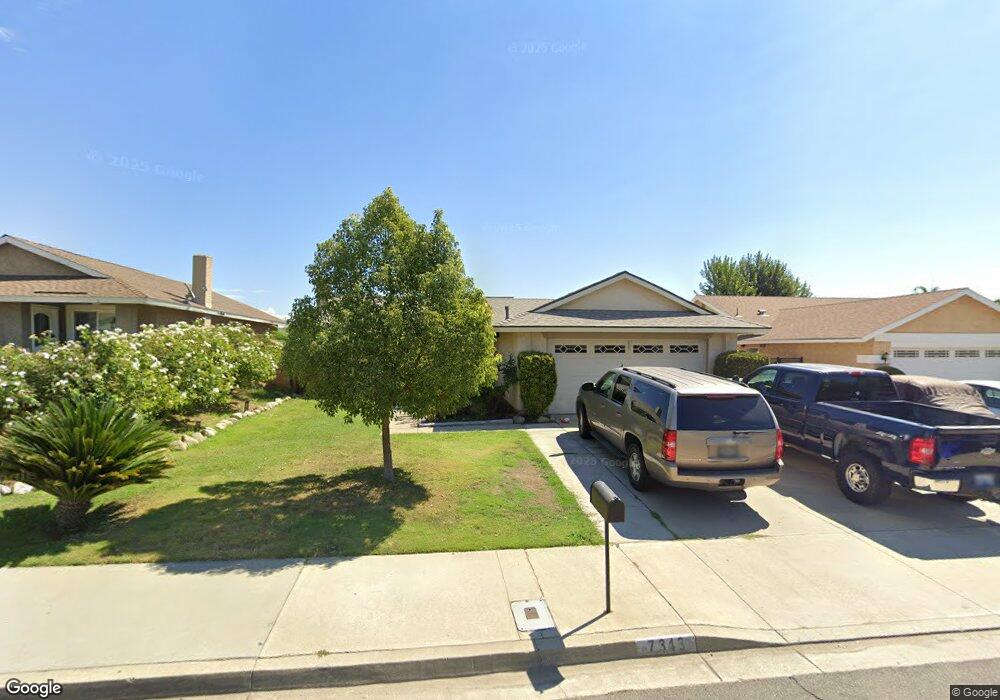
7343 Teak Way Rancho Cucamonga, CA 91730
Estimated Value: $709,834 - $754,000
3
Beds
2
Baths
1,476
Sq Ft
$495/Sq Ft
Est. Value
About This Home
This home is located at 7343 Teak Way, Rancho Cucamonga, CA 91730 and is currently estimated at $731,209, approximately $495 per square foot. 7343 Teak Way is a home located in San Bernardino County with nearby schools including Dona Merced Elementary, Ruth Musser Middle, and Rancho Cucamonga High School.
Ownership History
Date
Name
Owned For
Owner Type
Purchase Details
Closed on
Sep 12, 2024
Sold by
Rico John and Rico Angela M
Bought by
John And Angela Rico Living Trust and Rico
Current Estimated Value
Purchase Details
Closed on
Feb 6, 1998
Sold by
Rico Family Living Trust
Bought by
Rico John and Rico Angela M
Purchase Details
Closed on
Nov 15, 1996
Sold by
Rico Rudolph N and Rico Dolores
Bought by
Trustees Of The Rico Family Living Trust
Purchase Details
Closed on
May 19, 1995
Sold by
Tate Darlene
Bought by
Rico Rudolph N and Rico Dolores
Home Financials for this Owner
Home Financials are based on the most recent Mortgage that was taken out on this home.
Original Mortgage
$100,400
Interest Rate
7.88%
Purchase Details
Closed on
Apr 5, 1995
Sold by
Ericson Clifford C and Ericson Diane L
Bought by
Tate Darlene
Home Financials for this Owner
Home Financials are based on the most recent Mortgage that was taken out on this home.
Original Mortgage
$100,400
Interest Rate
7.88%
Create a Home Valuation Report for This Property
The Home Valuation Report is an in-depth analysis detailing your home's value as well as a comparison with similar homes in the area
Home Values in the Area
Average Home Value in this Area
Purchase History
| Date | Buyer | Sale Price | Title Company |
|---|---|---|---|
| John And Angela Rico Living Trust | -- | None Listed On Document | |
| Rico John | -- | -- | |
| Trustees Of The Rico Family Living Trust | -- | -- | |
| Rico Rudolph N | $125,500 | Commonwealth Land Title Co | |
| Tate Darlene | $106,584 | -- |
Source: Public Records
Mortgage History
| Date | Status | Borrower | Loan Amount |
|---|---|---|---|
| Previous Owner | Rico Rudolph N | $100,400 |
Source: Public Records
Tax History Compared to Growth
Tax History
| Year | Tax Paid | Tax Assessment Tax Assessment Total Assessment is a certain percentage of the fair market value that is determined by local assessors to be the total taxable value of land and additions on the property. | Land | Improvement |
|---|---|---|---|---|
| 2025 | $2,234 | $209,960 | $52,069 | $157,891 |
| 2024 | $2,234 | $205,843 | $51,048 | $154,795 |
| 2023 | $2,185 | $201,807 | $50,047 | $151,760 |
| 2022 | $2,149 | $197,850 | $49,066 | $148,784 |
| 2021 | $2,147 | $193,971 | $48,104 | $145,867 |
| 2020 | $2,085 | $191,982 | $47,611 | $144,371 |
| 2019 | $2,074 | $188,217 | $46,677 | $141,540 |
| 2018 | $2,015 | $184,527 | $45,762 | $138,765 |
| 2017 | $1,978 | $180,909 | $44,865 | $136,044 |
| 2016 | $1,953 | $177,361 | $43,985 | $133,376 |
| 2015 | $1,931 | $174,697 | $43,324 | $131,373 |
| 2014 | $1,874 | $171,275 | $42,475 | $128,800 |
Source: Public Records
Map
Nearby Homes
- 7285 Teak Way
- 9929 Palo Alto St
- 9800 Base Line Rd Unit 79
- 7420 London Ave
- 10210 Baseline Rd Unit 30
- 10210 Baseline Rd Unit 62
- 10210 Baseline Rd Unit 115
- 10210 Baseline Rd Unit 289
- 7524 Matterhorn Ave
- 9800 Baseline Rd Unit 76
- 9800 Baseline Rd Unit 71
- 9800 Baseline Rd Unit 17
- 9800 Baseline Rd Unit 82
- 9800 Baseline Rd Unit 62
- 7649 Dartmouth Ave
- 10350 Base Line Rd
- 10350 Base Line Rd Unit 192
- 9967 Yew Ct
- 7678 Ramona Ave
- 7018 Princeton Place
- 7333 Teak Way
- 7353 Teak Way
- 7344 Cambridge Ave
- 7323 Teak Way
- 7363 Teak Way
- 7334 Cambridge Ave
- 7354 Cambridge Ave
- 7342 Teak Way
- 7324 Cambridge Ave
- 7332 Teak Way
- 7364 Cambridge Ave
- 7352 Teak Way
- 7373 Teak Way
- 7313 Teak Way
- 7362 Teak Way
- 7322 Teak Way
- 7314 Cambridge Ave
- 7374 Cambridge Ave
- 7372 Teak Way
- 7312 Teak Way