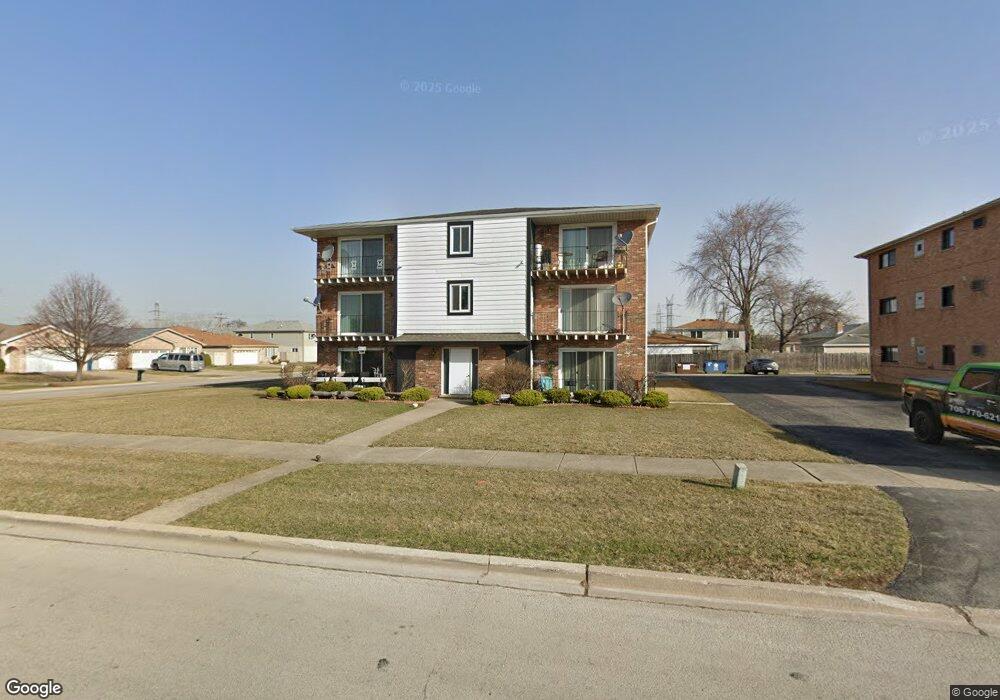
7344 W 85th Place Unit 3B Bridgeview, IL 60455
Estimated Value: $149,000 - $182,000
2
Beds
1
Bath
7,300
Sq Ft
$23/Sq Ft
Est. Value
About This Home
This home is located at 7344 W 85th Place Unit 3B, Bridgeview, IL 60455 and is currently estimated at $166,368, approximately $22 per square foot. 7344 W 85th Place Unit 3B is a home located in Cook County with nearby schools including Bridgeview Elementary School, Argo Community High School, and Aqsa School.
Ownership History
Date
Name
Owned For
Owner Type
Purchase Details
Closed on
Dec 29, 2008
Sold by
Hesser Agnieszka M and Baca Agnieszka M
Bought by
Zon Jadwiga
Current Estimated Value
Home Financials for this Owner
Home Financials are based on the most recent Mortgage that was taken out on this home.
Original Mortgage
$102,000
Outstanding Balance
$67,109
Interest Rate
5.96%
Mortgage Type
Unknown
Estimated Equity
$99,259
Purchase Details
Closed on
Nov 25, 2003
Sold by
Prahl Deborah A
Bought by
Baca Agnieszka M
Home Financials for this Owner
Home Financials are based on the most recent Mortgage that was taken out on this home.
Original Mortgage
$94,500
Interest Rate
7.85%
Mortgage Type
Unknown
Create a Home Valuation Report for This Property
The Home Valuation Report is an in-depth analysis detailing your home's value as well as a comparison with similar homes in the area
Home Values in the Area
Average Home Value in this Area
Purchase History
| Date | Buyer | Sale Price | Title Company |
|---|---|---|---|
| Zon Jadwiga | $120,000 | None Available | |
| Baca Agnieszka M | $105,000 | Cti |
Source: Public Records
Mortgage History
| Date | Status | Borrower | Loan Amount |
|---|---|---|---|
| Open | Zon Jadwiga | $102,000 | |
| Previous Owner | Baca Agnieszka M | $94,500 |
Source: Public Records
Tax History Compared to Growth
Tax History
| Year | Tax Paid | Tax Assessment Tax Assessment Total Assessment is a certain percentage of the fair market value that is determined by local assessors to be the total taxable value of land and additions on the property. | Land | Improvement |
|---|---|---|---|---|
| 2024 | $1,865 | $8,720 | $1,039 | $7,681 |
| 2023 | $1,376 | $8,720 | $1,039 | $7,681 |
| 2022 | $1,376 | $6,862 | $2,483 | $4,379 |
| 2021 | $1,362 | $6,862 | $2,483 | $4,379 |
| 2020 | $1,404 | $6,862 | $2,483 | $4,379 |
| 2019 | $1,745 | $7,664 | $2,252 | $5,412 |
| 2018 | $1,665 | $7,664 | $2,252 | $5,412 |
| 2017 | $1,655 | $7,664 | $2,252 | $5,412 |
| 2016 | $2,073 | $7,560 | $1,963 | $5,597 |
| 2015 | $1,915 | $7,560 | $1,963 | $5,597 |
| 2014 | $1,871 | $7,560 | $1,963 | $5,597 |
| 2013 | $2,485 | $9,918 | $1,963 | $7,955 |
Source: Public Records
Map
Nearby Homes
- 7345 W 85th Place Unit 3A
- 7336 W 86th St Unit 2B
- 7306 W 86th St Unit 3B
- 8800 S Harlem Ave Unit 19
- 8800 S Harlem Ave Unit 2311
- 8800 S Harlem Ave Unit 2111
- 8800 S Harlem Ave
- 8232 S Ferdinand Ave
- 8332 S 77th Ct
- 7110 W 82nd Place
- 8101 S Oketo Ave
- 8400 New England Ave
- 8738 Newland Ave
- 7806 W 83rd St
- 8332 S 78th Ct
- 7722 W 81st Place
- 9003 Milford Ct
- 8602 Oak Park Ave
- 8912 Windsor Ln
- 8356 Oak Park Ave
- 7344 W 85th Place Unit 1B
- 7344 W 85th Place Unit 2A
- 7344 W 85th Place Unit 1A
- 7344 W 85th Place Unit 3A
- 7344 W 85th Place Unit 2B
- 7336 W 85th Place Unit 2B
- 7336 W 85th Place Unit 3A
- 7336 W 85th Place Unit 2A
- 7336 W 85th Place Unit 1B
- 7336 W 85th Place Unit 1A
- 7336 W 85th Place Unit 3B
- 7341 W 85th St
- 7335 W 85th St
- 7331 W 85th St
- 8514 S Oketo Ave
- 7328 W 85th Place Unit 3B
- 7328 W 85th Place Unit 3A
- 7328 W 85th Place Unit 1B
- 7328 W 85th Place Unit 1A
- 7328 W 85th Place Unit 2B