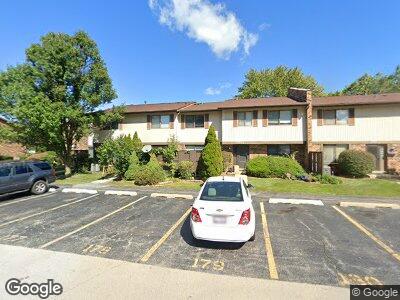
7345 Winthrop Way Unit 9 Downers Grove, IL 60516
South Downers Grove NeighborhoodEstimated Value: $235,000 - $257,000
3
Beds
2
Baths
1,177
Sq Ft
$207/Sq Ft
Est. Value
About This Home
This home is located at 7345 Winthrop Way Unit 9, Downers Grove, IL 60516 and is currently estimated at $243,686, approximately $207 per square foot. 7345 Winthrop Way Unit 9 is a home located in DuPage County with nearby schools including Mark Delay School, Lace Elementary School, and Eisenhower Jr High School.
Ownership History
Date
Name
Owned For
Owner Type
Purchase Details
Closed on
Jan 16, 2007
Sold by
Soroka Yuriy and Soroka Aleksandra
Bought by
Nishanth Naina Nanu and Puthanvalappil Nishanth K
Current Estimated Value
Home Financials for this Owner
Home Financials are based on the most recent Mortgage that was taken out on this home.
Original Mortgage
$145,600
Outstanding Balance
$105,440
Interest Rate
9.62%
Mortgage Type
Purchase Money Mortgage
Estimated Equity
$147,602
Purchase Details
Closed on
Nov 27, 2001
Sold by
Williams Pasty J
Bought by
Soroka Yuriy and Soroka Aleksandra
Home Financials for this Owner
Home Financials are based on the most recent Mortgage that was taken out on this home.
Original Mortgage
$127,555
Interest Rate
6.64%
Mortgage Type
FHA
Purchase Details
Closed on
Nov 1, 1994
Sold by
Maniacci Michael P and Maniacci Laurie
Bought by
Williams Patsy J
Home Financials for this Owner
Home Financials are based on the most recent Mortgage that was taken out on this home.
Original Mortgage
$85,500
Interest Rate
8.37%
Mortgage Type
Purchase Money Mortgage
Create a Home Valuation Report for This Property
The Home Valuation Report is an in-depth analysis detailing your home's value as well as a comparison with similar homes in the area
Home Values in the Area
Average Home Value in this Area
Purchase History
| Date | Buyer | Sale Price | Title Company |
|---|---|---|---|
| Nishanth Naina Nanu | $182,000 | First American Title Ins Co | |
| Soroka Yuriy | $131,500 | Premier Title | |
| Williams Patsy J | $90,000 | Attorneys Natl Title Network |
Source: Public Records
Mortgage History
| Date | Status | Borrower | Loan Amount |
|---|---|---|---|
| Open | Nishanth Naina Nanu | $145,600 | |
| Closed | Nishanth Naina Nanu | $36,400 | |
| Previous Owner | Soroka Yuriy | $35,000 | |
| Previous Owner | Soroka Yurity | $136,010 | |
| Previous Owner | Soroka Yuriy | $127,555 | |
| Previous Owner | Williams Patsy J | $85,500 |
Source: Public Records
Tax History Compared to Growth
Tax History
| Year | Tax Paid | Tax Assessment Tax Assessment Total Assessment is a certain percentage of the fair market value that is determined by local assessors to be the total taxable value of land and additions on the property. | Land | Improvement |
|---|---|---|---|---|
| 2023 | $3,465 | $60,080 | $6,200 | $53,880 |
| 2022 | $3,141 | $53,590 | $5,530 | $48,060 |
| 2021 | $3,050 | $52,980 | $5,470 | $47,510 |
| 2020 | $2,994 | $51,930 | $5,360 | $46,570 |
| 2019 | $2,892 | $49,820 | $5,140 | $44,680 |
| 2018 | $2,533 | $43,510 | $4,490 | $39,020 |
| 2017 | $2,451 | $41,870 | $4,320 | $37,550 |
| 2016 | $2,112 | $36,070 | $8,850 | $27,220 |
| 2015 | $2,064 | $33,940 | $8,330 | $25,610 |
| 2014 | $1,871 | $30,840 | $7,570 | $23,270 |
| 2013 | $2,379 | $38,360 | $9,410 | $28,950 |
Source: Public Records
Map
Nearby Homes
- 7333 Winthrop Way Unit 10
- 7342 Winthrop Way Unit 6
- 7333 Trent Rd
- 7303 Baybury Rd
- 7403 Canterbury Place Unit 212
- 7400 Grand Ave Unit A203
- 550 75th St Unit E201
- 7330 Fairview Ave Unit 104
- 7333 Grand Ave Unit 203
- 7128 Osage Ave
- 7516 Main St
- 7709 Florence Ave
- 731 67th St
- 7513 Rohrer Dr
- 505 Redondo Dr Unit 311
- 7930 Woodglen Ln Unit 204
- 819 Oxford St
- 444 Redondo Dr Unit 301
- 500 Redondo Dr Unit 212
- 7625 Dunham Rd
- 7345 Winthrop Way Unit 3
- 7339 Winthrop Way Unit 5
- 7339 Winthrop Way Unit 7
- 8 Tower Ct Unit 3
- 7345 Winthrop Way Unit 6
- 7345 Winthrop Way Unit 9
- 7339 Winthrop Way Unit 8
- 7339 Winthrop Way Unit 6
- 7345 Winthrop Way Unit 4
- 7345 Winthrop Way Unit 10
- 7339 Winthrop Way Unit 4
- 7345 Winthrop Way Unit 8
- 7345 Winthrop Way Unit 1
- 7339 Winthrop Way Unit 1015
- 7345 Winthrop Way Unit 5
- 7345 Winthrop Way Unit 1072
- 7345 Winthrop Way Unit 1047
- 7339 Winthrop Way Unit 1011
- 7345 Winthrop Way Unit 7
- 7339 Winthrop Way Unit 1