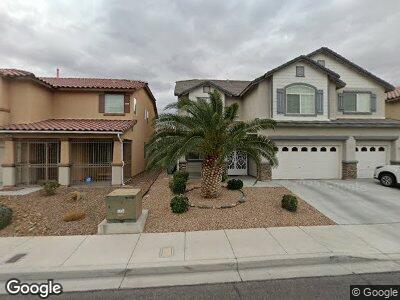
7347 Daily Double Ave Las Vegas, NV 89129
Lone Mountain NeighborhoodEstimated Value: $619,621 - $709,000
5
Beds
4
Baths
3,723
Sq Ft
$180/Sq Ft
Est. Value
About This Home
This home is located at 7347 Daily Double Ave, Las Vegas, NV 89129 and is currently estimated at $668,405, approximately $179 per square foot. 7347 Daily Double Ave is a home located in Clark County with nearby schools including Ruthe Deskin Elementary School, Justice Myron E Leavitt Middle School, and Centennial High School.
Ownership History
Date
Name
Owned For
Owner Type
Purchase Details
Closed on
Nov 4, 2010
Sold by
Chang John K and Juan Mei Ruey
Bought by
Cheng Felix Sing Kin
Current Estimated Value
Home Financials for this Owner
Home Financials are based on the most recent Mortgage that was taken out on this home.
Original Mortgage
$187,500
Outstanding Balance
$126,580
Interest Rate
4.27%
Mortgage Type
New Conventional
Estimated Equity
$567,610
Purchase Details
Closed on
May 13, 2005
Sold by
Chang John K
Bought by
Chang John K and Juan Mei Ruey
Home Financials for this Owner
Home Financials are based on the most recent Mortgage that was taken out on this home.
Original Mortgage
$50,000
Interest Rate
5.84%
Mortgage Type
Credit Line Revolving
Purchase Details
Closed on
Feb 25, 2004
Sold by
Kb Home Nevada Inc
Bought by
Chang John K and Chien Jen
Home Financials for this Owner
Home Financials are based on the most recent Mortgage that was taken out on this home.
Original Mortgage
$283,900
Interest Rate
5.62%
Mortgage Type
Unknown
Create a Home Valuation Report for This Property
The Home Valuation Report is an in-depth analysis detailing your home's value as well as a comparison with similar homes in the area
Home Values in the Area
Average Home Value in this Area
Purchase History
| Date | Buyer | Sale Price | Title Company |
|---|---|---|---|
| Cheng Felix Sing Kin | $250,000 | Noble Title | |
| Chang John K | $500,000 | North American Title Co | |
| Chang John K | -- | North American Title Co | |
| Chang John K | $356,155 | First American Title Co Of |
Source: Public Records
Mortgage History
| Date | Status | Borrower | Loan Amount |
|---|---|---|---|
| Open | Cheng Felix Sing Kin | $187,500 | |
| Previous Owner | Chang John K | $50,000 | |
| Previous Owner | Chang John K | $400,000 | |
| Previous Owner | Chang John K | $283,900 | |
| Previous Owner | Chang John K | $283,900 |
Source: Public Records
Tax History Compared to Growth
Tax History
| Year | Tax Paid | Tax Assessment Tax Assessment Total Assessment is a certain percentage of the fair market value that is determined by local assessors to be the total taxable value of land and additions on the property. | Land | Improvement |
|---|---|---|---|---|
| 2025 | $3,932 | $176,677 | $46,550 | $130,127 |
| 2024 | $4,099 | $176,677 | $46,550 | $130,127 |
| 2023 | $4,099 | $171,219 | $47,950 | $123,269 |
| 2022 | $3,372 | $146,513 | $34,300 | $112,213 |
| 2021 | $3,123 | $138,846 | $32,200 | $106,646 |
| 2020 | $2,897 | $137,384 | $31,850 | $105,534 |
| 2019 | $2,715 | $131,769 | $28,000 | $103,769 |
| 2018 | $2,590 | $121,937 | $23,100 | $98,837 |
| 2017 | $3,618 | $110,363 | $22,400 | $87,963 |
| 2016 | $2,425 | $100,113 | $16,450 | $83,663 |
| 2015 | $2,420 | $77,102 | $14,350 | $62,752 |
| 2014 | $2,344 | $69,393 | $7,000 | $62,393 |
Source: Public Records
Map
Nearby Homes
- 7317 Wild Roar Ave
- 7413 Turtle Dove Ct
- 7416 Deschutes Cir
- 4224 Glisan Ct
- 7473 Deschutes Cir
- 7405 Blue Sage Ct
- 7509 Wheat Grass Ct
- 4256 Perfect Drift St
- 4064 Browndeer Cir
- 7349 Dolphine Crest Ave
- 7241 Early Pioneer Ave
- 4041 Elkridge Dr
- 7360 Dolphine Crest Ave
- 7780 Hickam Ave
- 7418 Lawrence Powers Ct
- 10748 Wild Poppy Ave
- 7415 Constantinople Ave
- 4404 Dunlap Crossing St Unit 2
- 4416 Lilac Glen Dr
- 4504 Dunlap Crossing St
- 7347 Daily Double Ave
- 7341 Daily Double Ave
- 7353 Daily Double Ave
- 7346 Wild Roar Ave
- 7335 Daily Double Ave
- 7352 Wild Roar Ave Unit 3
- 7340 Wild Roar Ave
- 4124 Thunder Twice St Unit 4A
- 7334 Wild Roar Ave Unit 3
- 7329 Daily Double Ave
- 4128 Lady Burton St
- 4113 Thunder Twice St
- 7328 Wild Roar Ave
- 4117 Thunder Twice St
- 4128 Thunder Twice St
- 4132 Lady Burton St
- 4109 Thunder Twice St
- 4129 Brassy Boots Ct
- 7323 Daily Double Ave Unit 4A
- 4121 Thunder Twice St Unit 4A