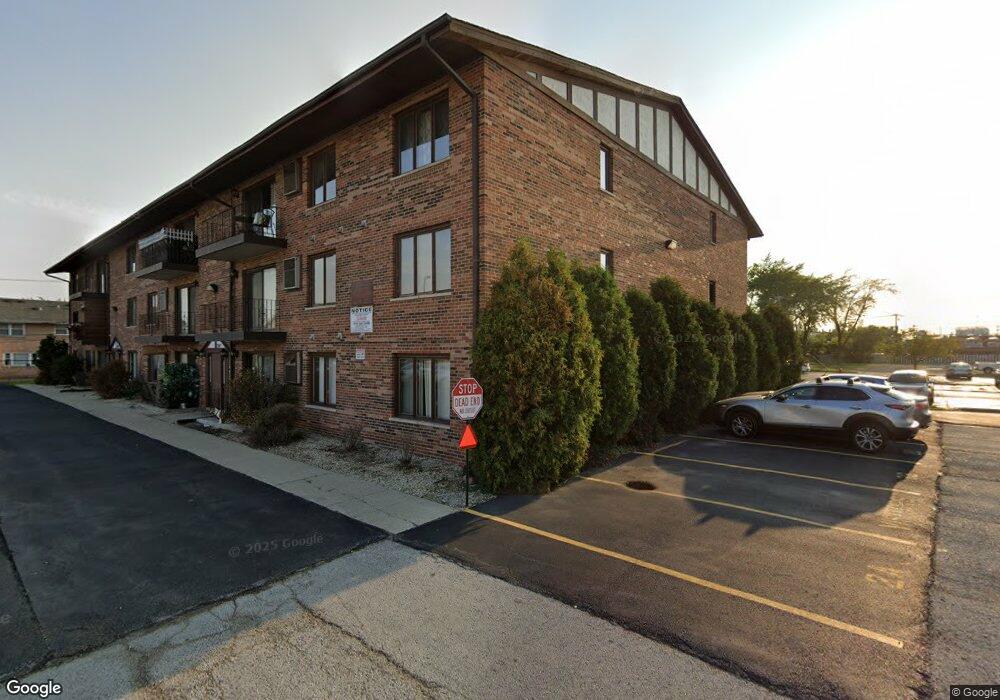
7347 W 79th Place Unit 3B Bridgeview, IL 60455
Estimated Value: $162,000 - $196,000
2
Beds
2
Baths
1,100
Sq Ft
$159/Sq Ft
Est. Value
About This Home
This home is located at 7347 W 79th Place Unit 3B, Bridgeview, IL 60455 and is currently estimated at $175,140, approximately $159 per square foot. 7347 W 79th Place Unit 3B is a home located in Cook County with nearby schools including Bridgeview Elementary School and Argo Community High School.
Ownership History
Date
Name
Owned For
Owner Type
Purchase Details
Closed on
Oct 1, 2008
Sold by
Vygovsky Vera
Bought by
Vigovsky Alexander
Current Estimated Value
Purchase Details
Closed on
Nov 16, 2004
Sold by
Vigovsky Alexander
Bought by
Vigovsky Alexander and Vygovsky Vera
Purchase Details
Closed on
Mar 5, 2002
Sold by
Marquette Bank
Bought by
Vigovsky Alexander
Home Financials for this Owner
Home Financials are based on the most recent Mortgage that was taken out on this home.
Original Mortgage
$82,800
Interest Rate
7.18%
Purchase Details
Closed on
Jun 18, 1998
Sold by
Harris Margaret R
Bought by
Marquette Natonal Bank and Trust #14488
Purchase Details
Closed on
May 10, 1995
Sold by
Drozd Beverly J
Bought by
Dahl Richard E
Home Financials for this Owner
Home Financials are based on the most recent Mortgage that was taken out on this home.
Original Mortgage
$65,000
Interest Rate
8.42%
Create a Home Valuation Report for This Property
The Home Valuation Report is an in-depth analysis detailing your home's value as well as a comparison with similar homes in the area
Home Values in the Area
Average Home Value in this Area
Purchase History
| Date | Buyer | Sale Price | Title Company |
|---|---|---|---|
| Vigovsky Alexander | -- | None Available | |
| Vigovsky Alexander | -- | -- | |
| Vigovsky Alexander | $92,000 | -- | |
| Marquette Natonal Bank | -- | -- | |
| Dahl Richard E | $85,000 | -- |
Source: Public Records
Mortgage History
| Date | Status | Borrower | Loan Amount |
|---|---|---|---|
| Previous Owner | Vigovsky Alexander | $82,800 | |
| Previous Owner | Dahl Richard E | $65,000 |
Source: Public Records
Tax History Compared to Growth
Tax History
| Year | Tax Paid | Tax Assessment Tax Assessment Total Assessment is a certain percentage of the fair market value that is determined by local assessors to be the total taxable value of land and additions on the property. | Land | Improvement |
|---|---|---|---|---|
| 2024 | $2,956 | $11,883 | $827 | $11,056 |
| 2023 | $1,783 | $11,882 | $826 | $11,056 |
| 2022 | $1,783 | $7,881 | $1,423 | $6,458 |
| 2021 | $1,755 | $7,881 | $1,423 | $6,458 |
| 2020 | $1,784 | $7,881 | $1,423 | $6,458 |
| 2019 | $2,280 | $8,961 | $1,285 | $7,676 |
| 2018 | $2,176 | $8,961 | $1,285 | $7,676 |
| 2017 | $2,156 | $8,961 | $1,285 | $7,676 |
| 2016 | $2,145 | $7,734 | $1,101 | $6,633 |
| 2015 | $1,982 | $7,734 | $1,101 | $6,633 |
| 2014 | $1,937 | $7,734 | $1,101 | $6,633 |
| 2013 | $1,927 | $8,282 | $1,101 | $7,181 |
Source: Public Records
Map
Nearby Homes
- 7945 S Oketo Ave Unit 404
- 8101 S Oketo Ave
- 7749 Odell Ave
- 7912 Nordica Ave
- 7656 W 80th Place
- 7726 W 80th Place
- 7110 W 82nd Place
- 8232 S Ferdinand Ave
- 7722 W 81st Place
- 7949 Newland Ave
- 7748 Newland Ave
- 7616 S 78th Ave
- 7727 New England Ave
- 7806 W 83rd St
- 7435 W 74th St
- 7125 W 74th St
- 7858 Rutherford Ave Unit 3D
- 7345 W 85th Place Unit 3A
- 7336 W 86th St Unit 2B
- 7332 Beloit Ave
- 7347 W 79th Place Unit 2C
- 7347 W 79th Place Unit 2B
- 7347 W 79th Place Unit 1B
- 7347 W 79th Place Unit 3C
- 7347 W 79th Place Unit 3D
- 7347 W 79th Place Unit 3A
- 7347 W 79th Place Unit 1D
- 7347 W 79th Place Unit 3E
- 7347 W 79th Place Unit 1A
- 7347 W 79th Place Unit 3F
- 7347 W 79th Place Unit 2A
- 7347 W 79th Place Unit 1C
- 7347 W 79th Place Unit 2D
- 7347 W 79th Place Unit A
- 7347 W 79th Place Unit B
- 7349 W 79th Place Unit 2F
- 7349 W 79th Place Unit 2E
- 7349 W 79th Place Unit 1E
- 7349 W 79th Place Unit 1F
- 7349 W 79th Place Unit 3F