Estimated Value: $421,000 - $449,000
4
Beds
2
Baths
1,106
Sq Ft
$396/Sq Ft
Est. Value
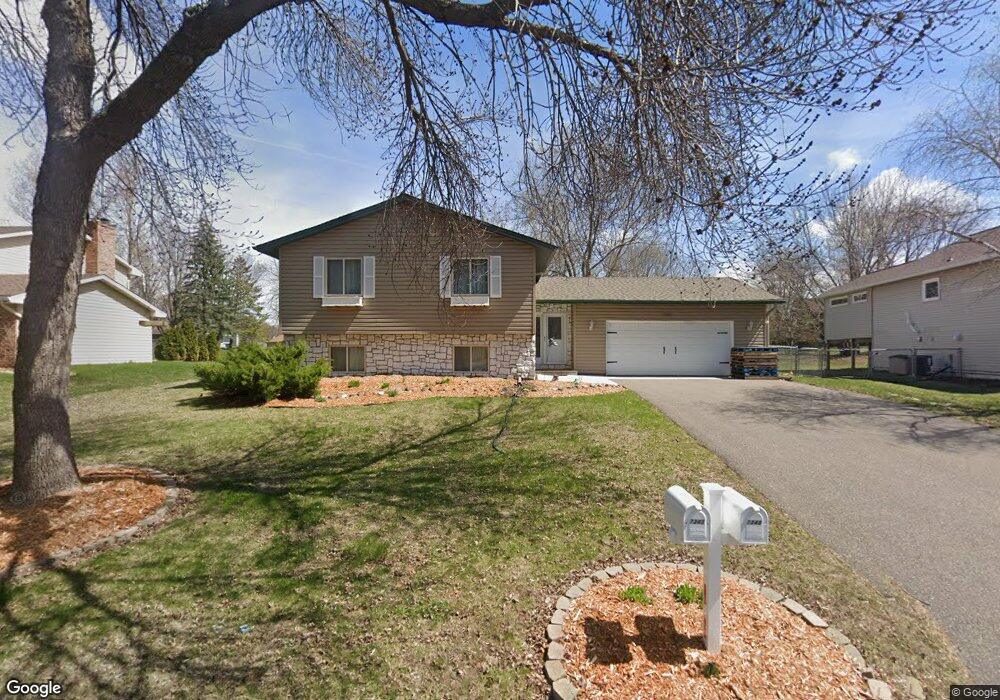
About This Home
This home is located at 7348 Quantico Ln N, Osseo, MN 55311 and is currently estimated at $437,940, approximately $395 per square foot. 7348 Quantico Ln N is a home located in Hennepin County with nearby schools including Basswood Elementary School, Maple Grove Middle School, and Maple Grove Senior High School.
Ownership History
Date
Name
Owned For
Owner Type
Purchase Details
Closed on
Aug 7, 2018
Sold by
Fread Joseph and Fread Ruth
Bought by
Plasencia Zapata Francisco A and Plasencia Laura E
Current Estimated Value
Home Financials for this Owner
Home Financials are based on the most recent Mortgage that was taken out on this home.
Original Mortgage
$328,830
Outstanding Balance
$287,851
Interest Rate
4.87%
Mortgage Type
Adjustable Rate Mortgage/ARM
Estimated Equity
$150,089
Purchase Details
Closed on
May 16, 2016
Sold by
Royzman Leonid and Royzman Tatyana
Bought by
Fread Joseph and Fread Ruth
Home Financials for this Owner
Home Financials are based on the most recent Mortgage that was taken out on this home.
Original Mortgage
$193,600
Interest Rate
3.58%
Mortgage Type
New Conventional
Purchase Details
Closed on
Apr 25, 1997
Sold by
Bender Jeffrey M and Bender Elaine R
Bought by
Royzman Loenid and Royzman Tatyana
Create a Home Valuation Report for This Property
The Home Valuation Report is an in-depth analysis detailing your home's value as well as a comparison with similar homes in the area
Home Values in the Area
Average Home Value in this Area
Purchase History
| Date | Buyer | Sale Price | Title Company |
|---|---|---|---|
| Plasencia Zapata Francisco A | $339,000 | Lendserv National Title Inc | |
| Fread Joseph | $242,000 | Lendserv National Title & In | |
| Royzman Loenid | $127,500 | -- |
Source: Public Records
Mortgage History
| Date | Status | Borrower | Loan Amount |
|---|---|---|---|
| Open | Plasencia Zapata Francisco A | $328,830 | |
| Previous Owner | Fread Joseph | $193,600 |
Source: Public Records
Tax History
| Year | Tax Paid | Tax Assessment Tax Assessment Total Assessment is a certain percentage of the fair market value that is determined by local assessors to be the total taxable value of land and additions on the property. | Land | Improvement |
|---|---|---|---|---|
| 2024 | $4,862 | $407,700 | $139,700 | $268,000 |
| 2023 | $4,520 | $387,300 | $112,500 | $274,800 |
| 2022 | $4,016 | $394,900 | $104,900 | $290,000 |
| 2021 | $3,785 | $336,600 | $87,100 | $249,500 |
| 2020 | $3,751 | $314,000 | $71,100 | $242,900 |
| 2019 | $3,759 | $297,000 | $67,000 | $230,000 |
| 2018 | $3,963 | $282,400 | $76,500 | $205,900 |
| 2017 | $3,556 | $235,300 | $72,000 | $163,300 |
| 2016 | $3,528 | $230,600 | $72,000 | $158,600 |
| 2015 | $3,260 | $208,700 | $57,000 | $151,700 |
| 2014 | -- | $194,200 | $57,000 | $137,200 |
Source: Public Records
Map
Nearby Homes
- 15653 73rd Cir N
- 15375 75th Place N
- 7340 Niagara Ln N
- 7244 Terraceview Ln N
- 7585 Lanewood Ln N
- 7453 Mariner Dr
- 7698 Orchid Ln N
- 7099 Weston Ln N
- 16103 70th Place N
- 7932 Orchid Ln N
- 7945 Ranchview Ln N
- 7993 Ranchview Ln N
- 7465 Dallas Ln N
- 7496 Berkshire Way
- 16506 78th Ave N
- 7336 Fountain Ln N
- 16917 73rd Place N
- 7684 Fountain Ln N
- 16759 78th Ave N
- 6724 Timber Crest Dr
- 7356 Quantico Ln N
- 7338 Quantico Ln N
- 7365 Orchid Ln N
- 7374 Quantico Ln N
- 7330 Quantico Ln N
- 7368 Orchid Ln N
- 7343 Quantico Ln N
- 15321 74th Ave N
- 7353 Quantico Ln N
- 15349 74th Ave N
- 15293 74th Ave N
- 7363 Orchid Ln N
- 7335 Quantico Ln N
- 15271 74th Ave N
- 7326 Quantico Ln N
- 7366 Orchid Ln N
- 15288 73rd Place N
- 7365 Quantico Ln N
- 7323 Quantico Ln N
- 15245 74th Ave N
Your Personal Tour Guide
Ask me questions while you tour the home.