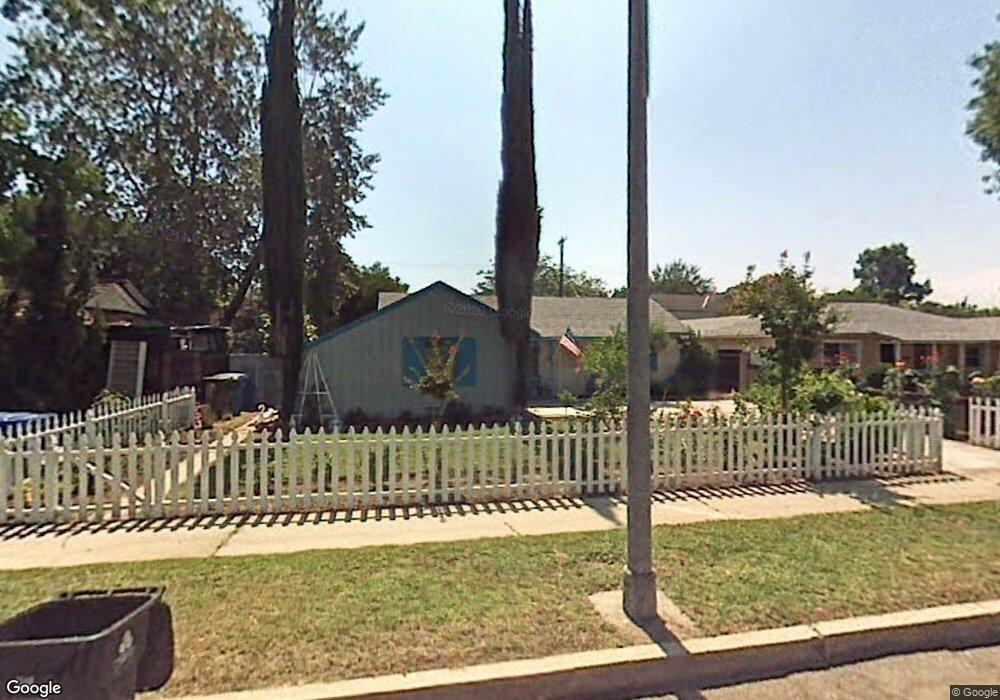
7348 Shoshone Ave van Nuys, CA 91406
Estimated Value: $705,000 - $804,000
2
Beds
1
Bath
806
Sq Ft
$933/Sq Ft
Est. Value
About This Home
This home is located at 7348 Shoshone Ave, van Nuys, CA 91406 and is currently estimated at $751,727, approximately $932 per square foot. 7348 Shoshone Ave is a home located in Los Angeles County with nearby schools including Anatola Avenue Elementary School, William Mulholland Middle, and Magnolia Science Academy.
Ownership History
Date
Name
Owned For
Owner Type
Purchase Details
Closed on
Jun 19, 2025
Sold by
Rojo Adilia
Bought by
Adilia Rojo Living Trust and Rojo
Current Estimated Value
Purchase Details
Closed on
Jun 10, 2002
Sold by
Tun Alfredo and Mayes Francisca P
Bought by
Rojo Adilia
Home Financials for this Owner
Home Financials are based on the most recent Mortgage that was taken out on this home.
Original Mortgage
$205,000
Interest Rate
6.7%
Mortgage Type
Stand Alone First
Purchase Details
Closed on
Nov 9, 2001
Sold by
Tun Alfredo and Mayes Francisca P
Bought by
Rojo Adilia
Purchase Details
Closed on
Mar 17, 2000
Sold by
Palmer Smith Leah M
Bought by
Tun Alfredo and Mayes Francisca P
Home Financials for this Owner
Home Financials are based on the most recent Mortgage that was taken out on this home.
Original Mortgage
$156,950
Interest Rate
8.24%
Mortgage Type
FHA
Create a Home Valuation Report for This Property
The Home Valuation Report is an in-depth analysis detailing your home's value as well as a comparison with similar homes in the area
Home Values in the Area
Average Home Value in this Area
Purchase History
| Date | Buyer | Sale Price | Title Company |
|---|---|---|---|
| Adilia Rojo Living Trust | -- | None Listed On Document | |
| Rojo Adilia | -- | American Title Co | |
| Rojo Adilia | -- | -- | |
| Tun Alfredo | $158,000 | Southland Title |
Source: Public Records
Mortgage History
| Date | Status | Borrower | Loan Amount |
|---|---|---|---|
| Previous Owner | Rojo Adilia | $205,000 | |
| Previous Owner | Tun Alfredo | $156,950 |
Source: Public Records
Tax History
| Year | Tax Paid | Tax Assessment Tax Assessment Total Assessment is a certain percentage of the fair market value that is determined by local assessors to be the total taxable value of land and additions on the property. | Land | Improvement |
|---|---|---|---|---|
| 2025 | $4,203 | $332,367 | $132,943 | $199,424 |
| 2024 | $4,203 | $325,851 | $130,337 | $195,514 |
| 2023 | $4,126 | $319,463 | $127,782 | $191,681 |
| 2022 | $3,939 | $313,200 | $125,277 | $187,923 |
| 2021 | $3,891 | $307,060 | $122,821 | $184,239 |
| 2019 | $3,779 | $297,954 | $119,179 | $178,775 |
| 2018 | $3,687 | $292,113 | $116,843 | $175,270 |
| 2016 | $3,524 | $280,771 | $112,306 | $168,465 |
| 2015 | $3,474 | $276,555 | $110,620 | $165,935 |
| 2014 | $3,493 | $271,139 | $108,454 | $162,685 |
Source: Public Records
Map
Nearby Homes
- 17419 Leadwell St
- 17431 Valerio St
- 17460 Cohasset St
- 17522 Sherman Way Unit 204
- 17500 Sherman Way Unit 102
- 17419 Cohasset St
- 7113 Encino Ave
- 7333 Jamieson Ave
- 7630 Jellico Ave
- 7631 Texhoma Ave
- 7466 Louise Ave
- 17460 Keswick St
- 17337 Saticoy St
- 17900 Sherman Way Unit 226
- 7001 Bianca Ave
- 7001 Lasaine Ave
- 6930 Balcom Ave
- 6941 Louise Ave
- 6914 Andasol Ave
- 17065 Cantlay St
- 7356 Shoshone Ave
- 7340 Shoshone Ave
- 7343 Caldus Ave
- 7334 Shoshone Ave
- 7331 Caldus Ave
- 17606 Valerio St
- 7345 Shoshone Ave
- 7325 Caldus Ave
- 7326 Shoshone Ave
- 7339 Shoshone Ave
- 7402 Shoshone Ave
- 7351 Caldus Ave
- 17614 Valerio St
- 7333 Shoshone Ave
- 7321 Caldus Ave
- 7320 Shoshone Ave
- 7410 Shoshone Ave
- 17605 Valerio St
- 7357 Caldus Ave
- 7340 Caldus Ave
Your Personal Tour Guide
Ask me questions while you tour the home.