Estimated Value: $2,810,000 - $3,320,520
4
Beds
3
Baths
4,581
Sq Ft
$656/Sq Ft
Est. Value
About This Home
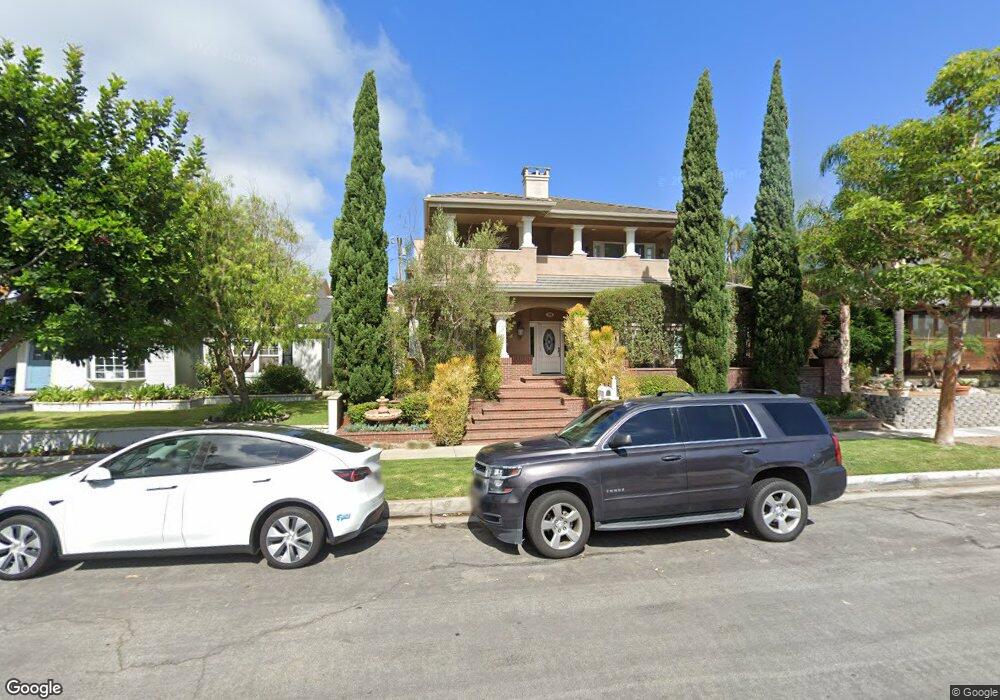
This home is located at 735 13th St, Huntington Beach, CA 92648 and is currently estimated at $3,003,630, approximately $655 per square foot. 735 13th St is a home located in Orange County with nearby schools including Agnes L. Smith Elementary, Ethel Dwyer Middle, and Huntington Beach High School.
Ownership History
Date
Name
Owned For
Owner Type
Purchase Details
Closed on
Sep 28, 2022
Sold by
Stephen Marquardt
Bought by
Stephen Rodger Marquardt 2000 Trust
Current Estimated Value
Purchase Details
Closed on
Nov 11, 1994
Sold by
Marquardt Janet K
Bought by
Marquardt Stephen
Purchase Details
Closed on
Aug 16, 1993
Sold by
Foster Michael B and Foster Jo Ann
Bought by
Marquardt Stephen R and Marquardt Janet Kay
Home Financials for this Owner
Home Financials are based on the most recent Mortgage that was taken out on this home.
Original Mortgage
$441,600
Interest Rate
6.98%
Create a Home Valuation Report for This Property
The Home Valuation Report is an in-depth analysis detailing your home's value as well as a comparison with similar homes in the area
Home Values in the Area
Average Home Value in this Area
Purchase History
| Date | Buyer | Sale Price | Title Company |
|---|---|---|---|
| Stephen Rodger Marquardt 2000 Trust | -- | -- | |
| Marquardt Stephen | -- | -- | |
| Marquardt Stephen R | $552,000 | Gateway Title Company |
Source: Public Records
Mortgage History
| Date | Status | Borrower | Loan Amount |
|---|---|---|---|
| Previous Owner | Marquardt Stephen R | $441,600 |
Source: Public Records
Tax History Compared to Growth
Tax History
| Year | Tax Paid | Tax Assessment Tax Assessment Total Assessment is a certain percentage of the fair market value that is determined by local assessors to be the total taxable value of land and additions on the property. | Land | Improvement |
|---|---|---|---|---|
| 2025 | $11,997 | $1,080,745 | $490,607 | $590,138 |
| 2024 | $11,997 | $1,059,554 | $480,987 | $578,567 |
| 2023 | $11,729 | $1,038,779 | $471,556 | $567,223 |
| 2022 | $11,422 | $1,018,411 | $462,310 | $556,101 |
| 2021 | $11,208 | $998,443 | $453,245 | $545,198 |
| 2020 | $11,136 | $988,206 | $448,598 | $539,608 |
| 2019 | $11,000 | $968,830 | $439,802 | $529,028 |
| 2018 | $10,829 | $949,834 | $431,179 | $518,655 |
| 2017 | $10,684 | $931,210 | $422,724 | $508,486 |
| 2016 | $10,204 | $912,951 | $414,435 | $498,516 |
| 2015 | $10,107 | $899,238 | $408,210 | $491,028 |
| 2014 | $9,895 | $881,624 | $400,214 | $481,410 |
Source: Public Records
Map
Nearby Homes