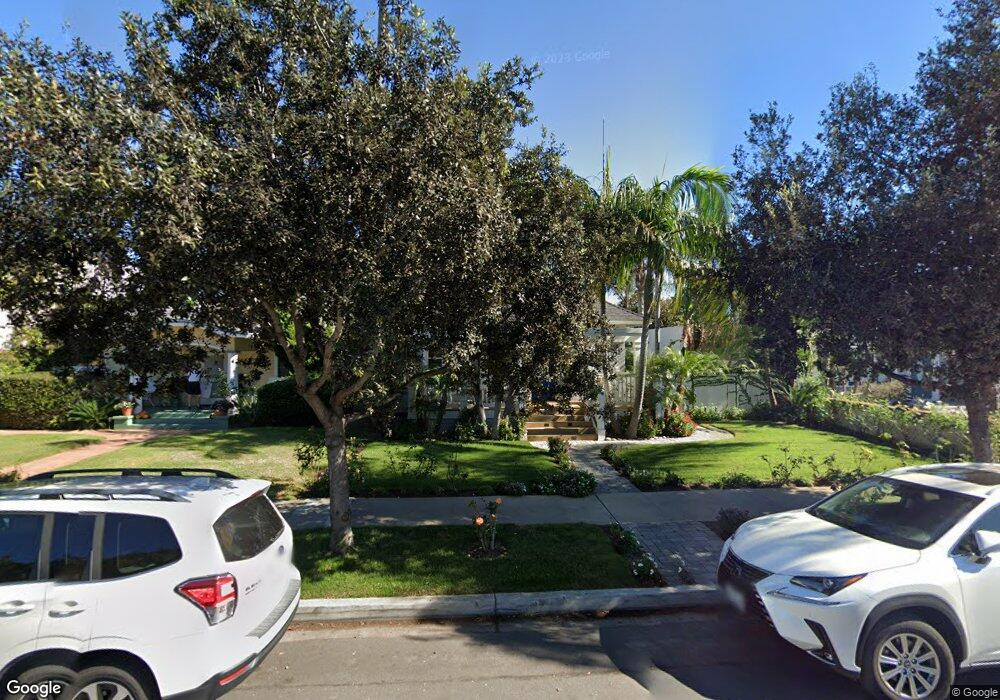
735 B Ave Coronado, CA 92118
Estimated Value: $3,075,952 - $3,967,000
4
Beds
4
Baths
2,425
Sq Ft
$1,434/Sq Ft
Est. Value
About This Home
This home is located at 735 B Ave, Coronado, CA 92118 and is currently estimated at $3,478,238, approximately $1,434 per square foot. 735 B Ave is a home located in San Diego County with nearby schools including Coronado Village Elementary, Coronado Middle School, and Coronado High School.
Ownership History
Date
Name
Owned For
Owner Type
Purchase Details
Closed on
Dec 22, 2019
Sold by
Thornton Nancy and Howard Frese Trust
Bought by
Drayne Daniel P and Drayne Enda E
Current Estimated Value
Home Financials for this Owner
Home Financials are based on the most recent Mortgage that was taken out on this home.
Original Mortgage
$1,840,000
Outstanding Balance
$1,614,813
Interest Rate
3.37%
Mortgage Type
New Conventional
Estimated Equity
$1,863,425
Purchase Details
Closed on
Oct 27, 2017
Sold by
Frese Howard L
Bought by
Frese Howard L and Howard Frese Trust
Purchase Details
Closed on
Oct 19, 2017
Sold by
Frese Mary F
Bought by
Frese Howard L
Purchase Details
Closed on
Jun 1, 2012
Sold by
Frese Howard L and Frese Mary F
Bought by
Frese Howard L and Frese Mary F
Purchase Details
Closed on
Oct 29, 2008
Sold by
Frese Donna N
Bought by
Frese Howard L
Purchase Details
Closed on
Sep 7, 2005
Sold by
Frese Mary F
Bought by
Frese Howard L
Purchase Details
Closed on
Nov 10, 1997
Sold by
Frese Virginia R
Bought by
Frese Virginia R and Frese Donna N
Create a Home Valuation Report for This Property
The Home Valuation Report is an in-depth analysis detailing your home's value as well as a comparison with similar homes in the area
Home Values in the Area
Average Home Value in this Area
Purchase History
| Date | Buyer | Sale Price | Title Company |
|---|---|---|---|
| Drayne Daniel P | $2,300,000 | California Title Company | |
| Frese Howard L | -- | None Available | |
| Frese Howard L | -- | None Available | |
| Frese Howard L | -- | None Available | |
| Frese Howard L | -- | None Available | |
| Frese Howard L | -- | None Available | |
| Frese Howard L | -- | None Available | |
| Frese Howard L | -- | None Available | |
| Frese Howard L | -- | North American Title | |
| Frese Virginia R | -- | -- |
Source: Public Records
Mortgage History
| Date | Status | Borrower | Loan Amount |
|---|---|---|---|
| Open | Drayne Daniel P | $1,840,000 |
Source: Public Records
Tax History
| Year | Tax Paid | Tax Assessment Tax Assessment Total Assessment is a certain percentage of the fair market value that is determined by local assessors to be the total taxable value of land and additions on the property. | Land | Improvement |
|---|---|---|---|---|
| 2025 | $17,238 | $1,620,869 | $1,392,328 | $228,541 |
| 2024 | $17,238 | $1,589,088 | $1,365,028 | $224,060 |
| 2023 | $16,963 | $1,557,930 | $1,338,263 | $219,667 |
| 2022 | $16,642 | $1,527,383 | $1,312,023 | $215,360 |
| 2021 | $16,396 | $1,497,436 | $1,286,298 | $211,138 |
| 2020 | $22,220 | $2,080,800 | $1,872,720 | $208,080 |
| 2019 | $22,145 | $2,040,000 | $1,836,000 | $204,000 |
| 2018 | $1,594 | $90,209 | $53,786 | $36,423 |
| 2017 | $1,537 | $88,441 | $52,732 | $35,709 |
| 2016 | $1,466 | $86,708 | $51,699 | $35,009 |
| 2015 | $1,412 | $85,407 | $50,923 | $34,484 |
| 2014 | $1,346 | $83,735 | $49,926 | $33,809 |
Source: Public Records
Map
Nearby Homes
- 861 B Ave
- 747 Orange Ave Unit 304
- 747 Orange Ave Unit 302
- 747 Orange Ave Unit 303
- 747 Orange Ave Unit 301
- 969 Adella Ave
- 713-19 D Ave
- 835 D Ave Unit 5
- 835 D Ave Unit 4
- 660 Margarita Ave
- 1533 10th St
- 832 San Luis Rey Ave
- 933 D Ave
- 835 E Ave Unit B
- 911 9th St
- 440 Pomona Ave
- 848 E Ave Unit L2
- 1010 5th St
- 1058 Isabella Ave
- 1155 Star Park Cir Unit 1A
Your Personal Tour Guide
Ask me questions while you tour the home.