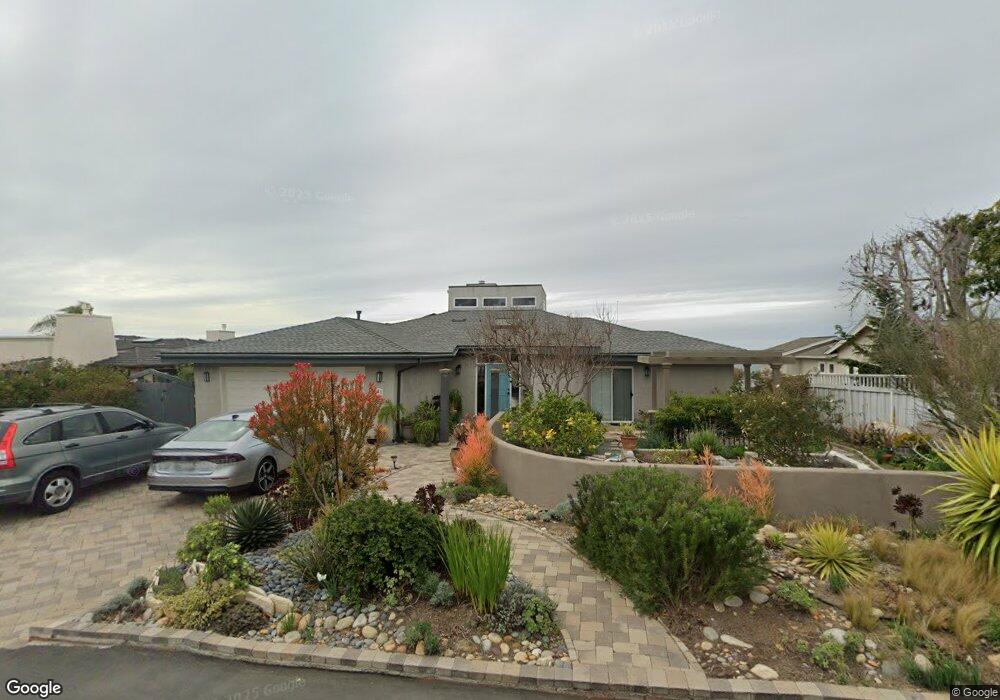
735 Barbara Ave Solana Beach, CA 92075
Estimated Value: $3,365,444 - $3,763,000
4
Beds
4
Baths
2,347
Sq Ft
$1,515/Sq Ft
Est. Value
About This Home
This home is located at 735 Barbara Ave, Solana Beach, CA 92075 and is currently estimated at $3,556,361, approximately $1,515 per square foot. 735 Barbara Ave is a home located in San Diego County with nearby schools including Skyline Elementary School, Solana Vista Elementary School, and Earl Warren Middle School.
Ownership History
Date
Name
Owned For
Owner Type
Purchase Details
Closed on
Jan 24, 2015
Sold by
Fisher Michael K and Meier Elizabeth K
Bought by
Meier Elizabeth K
Current Estimated Value
Purchase Details
Closed on
Jul 11, 2005
Sold by
Fisher Michael K and Meier Elizabeth K
Bought by
Fisher Michael K and Meier Elizabeth K
Home Financials for this Owner
Home Financials are based on the most recent Mortgage that was taken out on this home.
Original Mortgage
$359,650
Interest Rate
5.08%
Mortgage Type
Fannie Mae Freddie Mac
Purchase Details
Closed on
Jun 12, 1998
Sold by
Speth Bros Inc
Bought by
Pomeroy Tomas Dole and Pomeroy Sharon M
Home Financials for this Owner
Home Financials are based on the most recent Mortgage that was taken out on this home.
Original Mortgage
$19,500
Interest Rate
6.88%
Mortgage Type
Seller Take Back
Create a Home Valuation Report for This Property
The Home Valuation Report is an in-depth analysis detailing your home's value as well as a comparison with similar homes in the area
Home Values in the Area
Average Home Value in this Area
Purchase History
We collect this data history from publicly available records. To have your information removed, we recommend requesting removal directly through your county’s website.
| Date | Buyer | Sale Price | Title Company |
|---|---|---|---|
| Meier Elizabeth K | -- | None Available | |
| Fisher Michael K | -- | Chicago Title Co | |
| Pomeroy Tomas Dole | $25,000 | Benefit Land Title Company |
Source: Public Records
Mortgage History
We collect this data history from publicly available records. To have your information removed, we recommend requesting removal directly through your county’s website.
| Date | Status | Borrower | Loan Amount |
|---|---|---|---|
| Closed | Fisher Michael K | $359,650 | |
| Previous Owner | Pomeroy Tomas Dole | $19,500 |
Source: Public Records
Tax History
| Year | Tax Paid | Tax Assessment Tax Assessment Total Assessment is a certain percentage of the fair market value that is determined by local assessors to be the total taxable value of land and additions on the property. | Land | Improvement |
|---|---|---|---|---|
| 2025 | $7,476 | $547,782 | $327,421 | $220,361 |
| 2024 | $7,476 | $537,042 | $321,001 | $216,041 |
| 2023 | $7,374 | $526,512 | $314,707 | $211,805 |
| 2022 | $7,260 | $516,189 | $308,537 | $207,652 |
| 2021 | $7,184 | $506,069 | $302,488 | $203,581 |
| 2020 | $7,111 | $500,881 | $299,387 | $201,494 |
| 2019 | $6,144 | $491,061 | $293,517 | $197,544 |
| 2018 | $6,927 | $481,433 | $287,762 | $193,671 |
| 2017 | $6,794 | $471,994 | $282,120 | $189,874 |
| 2016 | $6,488 | $462,740 | $276,589 | $186,151 |
| 2015 | $6,369 | $455,790 | $272,435 | $183,355 |
| 2014 | $6,271 | $446,863 | $267,099 | $179,764 |
Source: Public Records
Map
Nearby Homes
- 779 Barbara Ave
- 637 N Rios Ave
- 849 N Rios Ave
- 109 Rios Ct
- 607 & 609 N Granados Ave Unit 607 & 609 N Granados
- 160 Solana Point Cir Unit 6
- 441 Holmwood Ln
- 353 Glenmont Dr
- 211 Ocean St
- 455 Glencrest Dr
- 427 Hilmen Place
- 309 Pacific Ave
- 212 N Helix Ave
- 2552 Ocean Cove Dr
- 725 Santa Florencia
- 831 Santa Rosita
- 326 S Nardo Ave
- 243 S Sierra Ave
- 418 Santa Dominga
- 421 Santa Helena
- 729 Barbara Ave
- 741 Barbara Ave
- 708 Midori Ct
- 723 Barbara Ave
- 745 Barbara Ave
- 706 Midori Ct
- 710 Midori Ct
- 704 Midori Ct
- 717 Barbara Ave
- 749 Barbara Ave
- 732 Barbara Ave
- 738 Barbara Ave
- 726 Barbara Ave
- 802 Midori Ct
- 744 Barbara Ave
- 720 Barbara Ave
- 711 Barbara Ave
- 755 Barbara Ave
- 702 Midori Ct
- 750 Barbara Ave
Your Personal Tour Guide
Ask me questions while you tour the home.