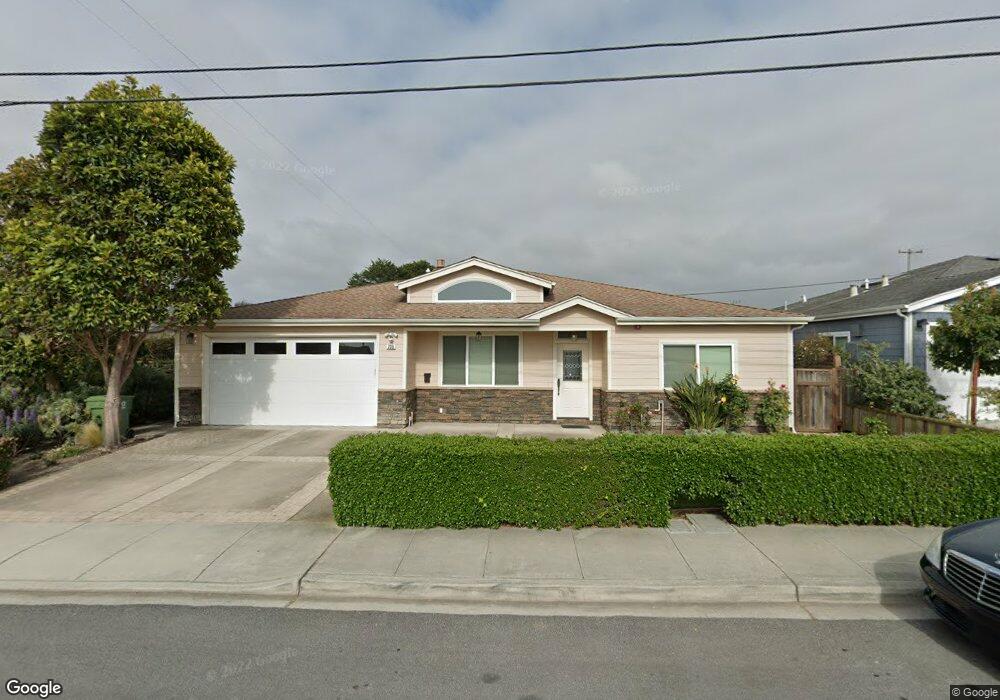
735 Third Ave Half Moon Bay, CA 94019
Estimated Value: $1,675,000 - $1,853,000
4
Beds
4
Baths
2,208
Sq Ft
$787/Sq Ft
Est. Value
About This Home
This home is located at 735 Third Ave, Half Moon Bay, CA 94019 and is currently estimated at $1,737,344, approximately $786 per square foot. 735 Third Ave is a home located in San Mateo County with nearby schools including Alvin S. Hatch Elementary School, Manuel F. Cunha Intermediate School, and Half Moon Bay High School.
Ownership History
Date
Name
Owned For
Owner Type
Purchase Details
Closed on
May 2, 2020
Sold by
White Pearl Trust and Singh Rupinder
Bought by
White Pearl Trust and Singh
Current Estimated Value
Home Financials for this Owner
Home Financials are based on the most recent Mortgage that was taken out on this home.
Original Mortgage
$466,200
Interest Rate
2%
Mortgage Type
New Conventional
Purchase Details
Closed on
Aug 19, 2013
Sold by
Singh Rupinder and Singh Paveena
Bought by
Singh Rupinder and Singh Paveena
Purchase Details
Closed on
Aug 17, 2005
Sold by
Micheliz Llc
Bought by
Singh Rupinder and Singh Paveena
Home Financials for this Owner
Home Financials are based on the most recent Mortgage that was taken out on this home.
Original Mortgage
$100,000
Interest Rate
5.56%
Mortgage Type
Credit Line Revolving
Purchase Details
Closed on
Mar 22, 2004
Sold by
Carey Helen J
Bought by
Micheliz Llc
Create a Home Valuation Report for This Property
The Home Valuation Report is an in-depth analysis detailing your home's value as well as a comparison with similar homes in the area
Home Values in the Area
Average Home Value in this Area
Purchase History
| Date | Buyer | Sale Price | Title Company |
|---|---|---|---|
| White Pearl Trust | -- | Amrock | |
| Singh Rupinder | -- | None Available | |
| Singh Rupinder | $899,000 | Old Republic Title Company | |
| Micheliz Llc | $100,000 | -- |
Source: Public Records
Mortgage History
| Date | Status | Borrower | Loan Amount |
|---|---|---|---|
| Previous Owner | White Pearl Trust | $466,200 | |
| Previous Owner | Singh Rupinder | $100,000 | |
| Previous Owner | Singh Rupinder | $674,250 |
Source: Public Records
Tax History
| Year | Tax Paid | Tax Assessment Tax Assessment Total Assessment is a certain percentage of the fair market value that is determined by local assessors to be the total taxable value of land and additions on the property. | Land | Improvement |
|---|---|---|---|---|
| 2025 | $14,812 | $1,228,542 | $614,271 | $614,271 |
| 2023 | $14,812 | $1,180,838 | $590,419 | $590,419 |
| 2022 | $13,934 | $1,157,686 | $578,843 | $578,843 |
| 2021 | $13,577 | $1,134,988 | $567,494 | $567,494 |
| 2020 | $13,468 | $1,123,352 | $561,676 | $561,676 |
| 2019 | $13,540 | $1,101,326 | $550,663 | $550,663 |
| 2018 | $12,606 | $1,079,732 | $539,866 | $539,866 |
| 2017 | $12,312 | $1,058,562 | $529,281 | $529,281 |
| 2016 | $12,167 | $1,037,806 | $518,903 | $518,903 |
| 2015 | $11,298 | $950,000 | $475,000 | $475,000 |
| 2014 | $9,050 | $760,000 | $380,000 | $380,000 |
Source: Public Records
Map
Nearby Homes
- 345 Granelli Ave
- 78 Amesport Landing
- 316 Grove St
- 229 Garcia Ave
- SW Cor 2nd Magnolia St
- 0 Magnolia Unit ML81987516
- 460 Pine Ave Unit 46
- 430 Pine Ave
- 525 Creekside Ct Unit LOT 2
- 535 Creekside Ct Unit LOT 3
- 470 Willow Ave
- 466 Willow Ave
- 577 Creekside Ct
- 71 Patrick Way
- 414 Belleville Blvd
- 411 Belleville Blvd
- 606 Highland Ave
- 0 Van Ness Ave Unit ML82035609
- 613 Grandview Blvd
- 0 Pacific Ave Unit ML82035704
Your Personal Tour Guide
Ask me questions while you tour the home.