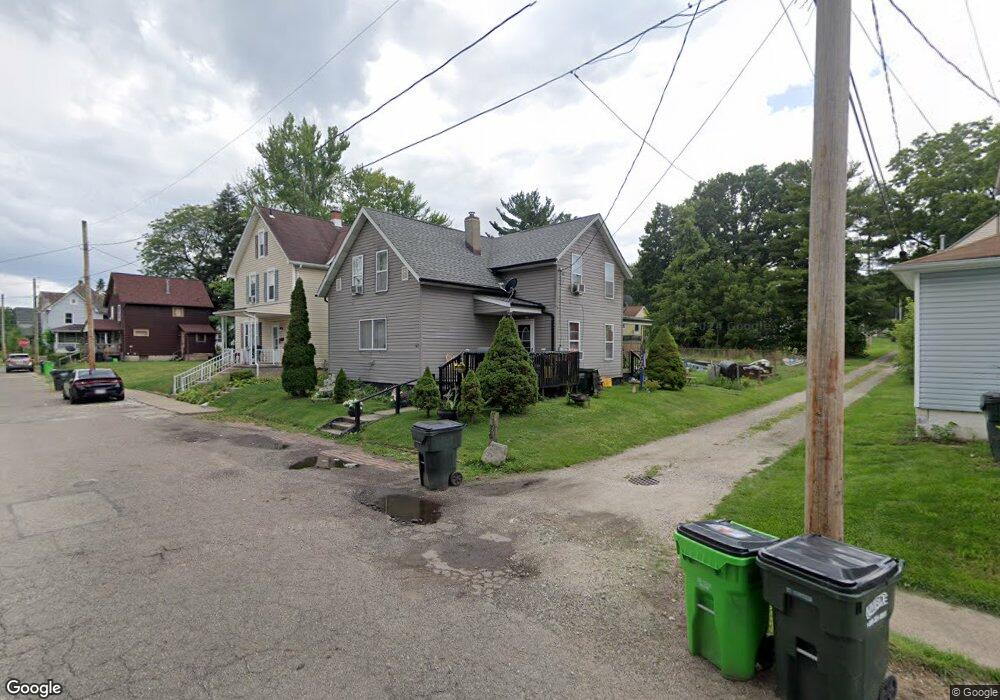
735 Wade Ave Alliance, OH 44601
Estimated Value: $66,634 - $103,000
3
Beds
2
Baths
1,392
Sq Ft
$61/Sq Ft
Est. Value
About This Home
This home is located at 735 Wade Ave, Alliance, OH 44601 and is currently estimated at $85,159, approximately $61 per square foot. 735 Wade Ave is a home located in Stark County with nearby schools including Alliance Intermediate School at Northside, Alliance Elementary School at Rockhill, and Alliance Middle School.
Ownership History
Date
Name
Owned For
Owner Type
Purchase Details
Closed on
May 5, 2010
Sold by
Dixon Lottie and Dixon Lottie M
Bought by
Stargen Jeffrey L and Stargen Tina L
Current Estimated Value
Purchase Details
Closed on
Mar 8, 2000
Sold by
Katherine Scott
Bought by
Wiseman Daryl G
Home Financials for this Owner
Home Financials are based on the most recent Mortgage that was taken out on this home.
Original Mortgage
$42,971
Interest Rate
8.26%
Mortgage Type
Purchase Money Mortgage
Purchase Details
Closed on
Mar 7, 2000
Sold by
Wiseman Daryl G
Bought by
Dixon Daniel and Dixon Lottie
Home Financials for this Owner
Home Financials are based on the most recent Mortgage that was taken out on this home.
Original Mortgage
$42,971
Interest Rate
8.26%
Mortgage Type
Purchase Money Mortgage
Purchase Details
Closed on
Mar 21, 1989
Create a Home Valuation Report for This Property
The Home Valuation Report is an in-depth analysis detailing your home's value as well as a comparison with similar homes in the area
Home Values in the Area
Average Home Value in this Area
Purchase History
| Date | Buyer | Sale Price | Title Company |
|---|---|---|---|
| Stargen Jeffrey L | -- | Attorney | |
| Wiseman Daryl G | $16,000 | -- | |
| Dixon Daniel | $50,000 | Prospect Title Agency Inc | |
| -- | $5,400 | -- |
Source: Public Records
Mortgage History
| Date | Status | Borrower | Loan Amount |
|---|---|---|---|
| Previous Owner | Dixon Daniel | $42,971 | |
| Closed | Dixon Daniel | $7,500 |
Source: Public Records
Tax History Compared to Growth
Tax History
| Year | Tax Paid | Tax Assessment Tax Assessment Total Assessment is a certain percentage of the fair market value that is determined by local assessors to be the total taxable value of land and additions on the property. | Land | Improvement |
|---|---|---|---|---|
| 2025 | -- | $9,100 | $3,360 | $5,740 |
| 2024 | $25 | $17,890 | $3,360 | $14,530 |
| 2023 | $25 | $8,050 | $3,430 | $4,620 |
| 2022 | $22 | $8,050 | $3,430 | $4,620 |
| 2021 | $22 | $8,050 | $3,430 | $4,620 |
| 2020 | $21 | $7,010 | $2,980 | $4,030 |
| 2019 | $63 | $7,010 | $2,980 | $4,030 |
| 2018 | $178 | $7,010 | $2,980 | $4,030 |
| 2017 | $18 | $7,010 | $2,490 | $4,520 |
| 2016 | $18 | $7,010 | $2,490 | $4,520 |
| 2015 | $197 | $14,780 | $2,490 | $12,290 |
| 2014 | -- | $8,340 | $2,280 | $6,060 |
| 2013 | -- | $8,340 | $2,280 | $6,060 |
Source: Public Records
Map
Nearby Homes
- 831 Wade Ave
- 814 Milner St
- 442 S Liberty Ave
- 1044 S Liberty Ave
- 452 E Summit St
- 1005 S Freedom Ave
- V/L S Fredeom Ave
- 1233 Woodland Ave
- 432 S Linden Ave
- 551 South St
- 1175 S Freedom Ave
- 1395 S Webb Ave
- 356 E Broadway St
- 729 Waugh St
- 1214 Jersey St
- 815 Grace St
- 361 E Main St
- 263 Franklin Ave
- 1437 S Linden Ave
- 807 S Union Ave