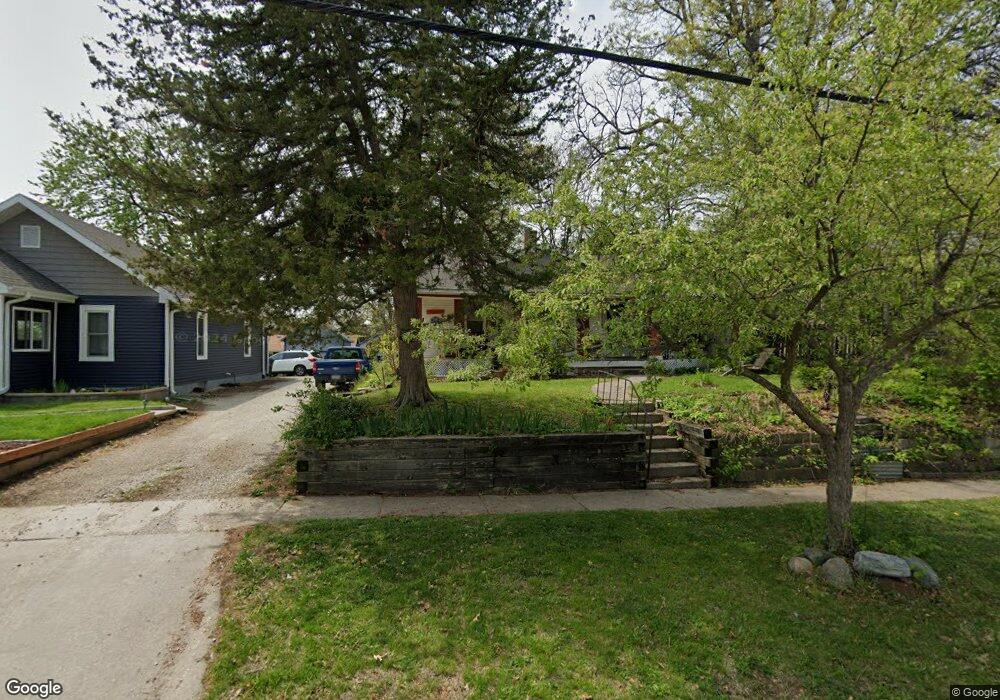
736 27th St Des Moines, IA 50312
Woodland Heights NeighborhoodEstimated Value: $126,000 - $191,000
2
Beds
1
Bath
852
Sq Ft
$200/Sq Ft
Est. Value
About This Home
This home is located at 736 27th St, Des Moines, IA 50312 and is currently estimated at $170,538, approximately $200 per square foot. 736 27th St is a home located in Polk County with nearby schools including Greenwood Elementary School and Roosevelt High School.
Ownership History
Date
Name
Owned For
Owner Type
Purchase Details
Closed on
Apr 21, 2006
Sold by
Bkm Renovators Lc
Bought by
Lamb Wilson Marla R
Current Estimated Value
Home Financials for this Owner
Home Financials are based on the most recent Mortgage that was taken out on this home.
Original Mortgage
$98,455
Outstanding Balance
$56,774
Interest Rate
6.42%
Mortgage Type
FHA
Estimated Equity
$113,764
Purchase Details
Closed on
May 5, 2005
Sold by
Neighborhood Hsng Svc Of Des Moines Inc and Gardner Steve
Bought by
Bkm Renovators Lc
Purchase Details
Closed on
Nov 16, 2000
Sold by
Newman Toffaro E
Bought by
Neighborhood Housing Services Of Des Moi
Create a Home Valuation Report for This Property
The Home Valuation Report is an in-depth analysis detailing your home's value as well as a comparison with similar homes in the area
Home Values in the Area
Average Home Value in this Area
Purchase History
| Date | Buyer | Sale Price | Title Company |
|---|---|---|---|
| Lamb Wilson Marla R | $99,500 | None Available | |
| Bkm Renovators Lc | $37,500 | -- | |
| Neighborhood Housing Services Of Des Moi | $51,500 | -- |
Source: Public Records
Mortgage History
| Date | Status | Borrower | Loan Amount |
|---|---|---|---|
| Open | Lamb Wilson Marla R | $98,455 |
Source: Public Records
Tax History Compared to Growth
Tax History
| Year | Tax Paid | Tax Assessment Tax Assessment Total Assessment is a certain percentage of the fair market value that is determined by local assessors to be the total taxable value of land and additions on the property. | Land | Improvement |
|---|---|---|---|---|
| 2025 | $2,772 | $174,600 | $34,000 | $140,600 |
| 2024 | $2,772 | $158,400 | $29,900 | $128,500 |
| 2023 | $2,758 | $158,400 | $29,900 | $128,500 |
| 2022 | $2,736 | $125,900 | $24,400 | $101,500 |
| 2021 | $2,568 | $125,900 | $24,400 | $101,500 |
| 2020 | $2,662 | $111,500 | $21,800 | $89,700 |
| 2019 | $2,394 | $111,500 | $21,800 | $89,700 |
| 2018 | $2,364 | $97,600 | $19,000 | $78,600 |
| 2017 | $2,294 | $97,600 | $19,000 | $78,600 |
| 2016 | $2,228 | $93,300 | $17,900 | $75,400 |
| 2015 | $2,228 | $93,300 | $17,900 | $75,400 |
| 2014 | $2,104 | $91,100 | $17,500 | $73,600 |
Source: Public Records
Map
Nearby Homes