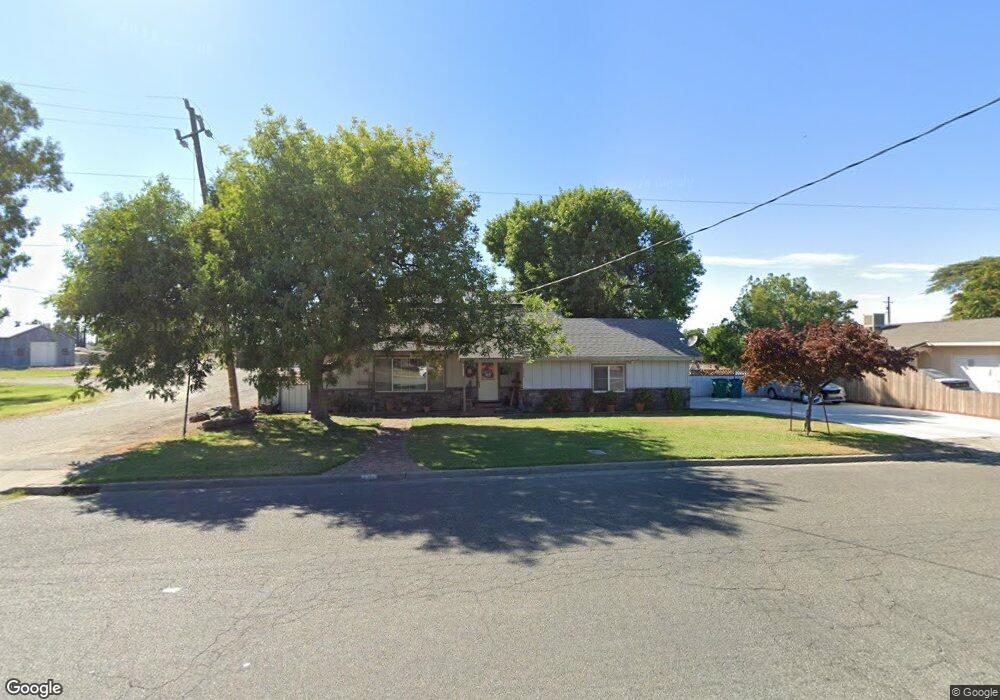
736 8th St Orland, CA 95963
Estimated Value: $223,000 - $389,000
3
Beds
2
Baths
1,568
Sq Ft
$195/Sq Ft
Est. Value
About This Home
This home is located at 736 8th St, Orland, CA 95963 and is currently estimated at $306,000, approximately $195 per square foot. 736 8th St is a home located in Glenn County with nearby schools including Mill Street Elementary School, Fairview Elementary School, and Price Intermediate School.
Ownership History
Date
Name
Owned For
Owner Type
Purchase Details
Closed on
Sep 19, 2017
Sold by
Forster Thomas and Forster Margaret
Bought by
Forster Thomas L and Forster Margaret R
Current Estimated Value
Purchase Details
Closed on
Apr 13, 2011
Sold by
Deutsche Bank National Trust Company
Bought by
Forster Thomas and Forster Margaret
Purchase Details
Closed on
Jan 15, 2011
Sold by
James Peggy A
Bought by
Deutsche Bank National Trust Company
Purchase Details
Closed on
Dec 3, 2007
Sold by
James Peggy
Bought by
Orland Artois Water District
Create a Home Valuation Report for This Property
The Home Valuation Report is an in-depth analysis detailing your home's value as well as a comparison with similar homes in the area
Purchase History
| Date | Buyer | Sale Price | Title Company |
|---|---|---|---|
| Forster Thomas L | -- | None Available | |
| Forster Thomas | $76,000 | Fidelity National Title Co | |
| Deutsche Bank National Trust Company | $151,542 | Servicelink | |
| Orland Artois Water District | $171 | None Available |
Source: Public Records
Tax History
| Year | Tax Paid | Tax Assessment Tax Assessment Total Assessment is a certain percentage of the fair market value that is determined by local assessors to be the total taxable value of land and additions on the property. | Land | Improvement |
|---|---|---|---|---|
| 2025 | $1,106 | $96,715 | $89,675 | $7,040 |
| 2024 | $1,106 | $94,819 | $87,917 | $6,902 |
| 2023 | $1,053 | $92,961 | $86,194 | $6,767 |
| 2022 | $1,036 | $91,139 | $84,504 | $6,635 |
| 2021 | $1,040 | $89,353 | $82,848 | $6,505 |
| 2020 | $1,040 | $88,438 | $81,999 | $6,439 |
| 2019 | $1,033 | $86,705 | $80,392 | $6,313 |
| 2018 | $960 | $85,006 | $78,816 | $6,190 |
| 2017 | $995 | $83,340 | $77,271 | $6,069 |
| 2016 | $935 | $81,706 | $75,756 | $5,950 |
| 2015 | -- | $80,480 | $74,619 | $5,861 |
| 2014 | $883 | $78,905 | $73,158 | $5,747 |
Source: Public Records
Map
Nearby Homes
- 621 Colusa St
- 100 Frances Ln
- 303 Colusa St
- 6412 County Road 14
- 6400 County Road Hh
- 1019 W Monterey St
- 4426 Commerce Ln
- 930 Kinder Cir
- 133 Tanner Way
- 0 South St Unit SN23178337
- 1229 Marin St
- 0 Hoff Way
- 1158 Hoff Way
- 4324 County Road Hh
- 104 South St
- 826 East St
- 512 East St
- 6386 County Road 200 Unit 35
- 1332 East St
- 634 Salomon Dr
Your Personal Tour Guide
Ask me questions while you tour the home.