736 Arroyo Ct Chula Vista, CA 91910
Rancho Del Rey NeighborhoodEstimated Value: $975,000 - $1,104,000
About This Home
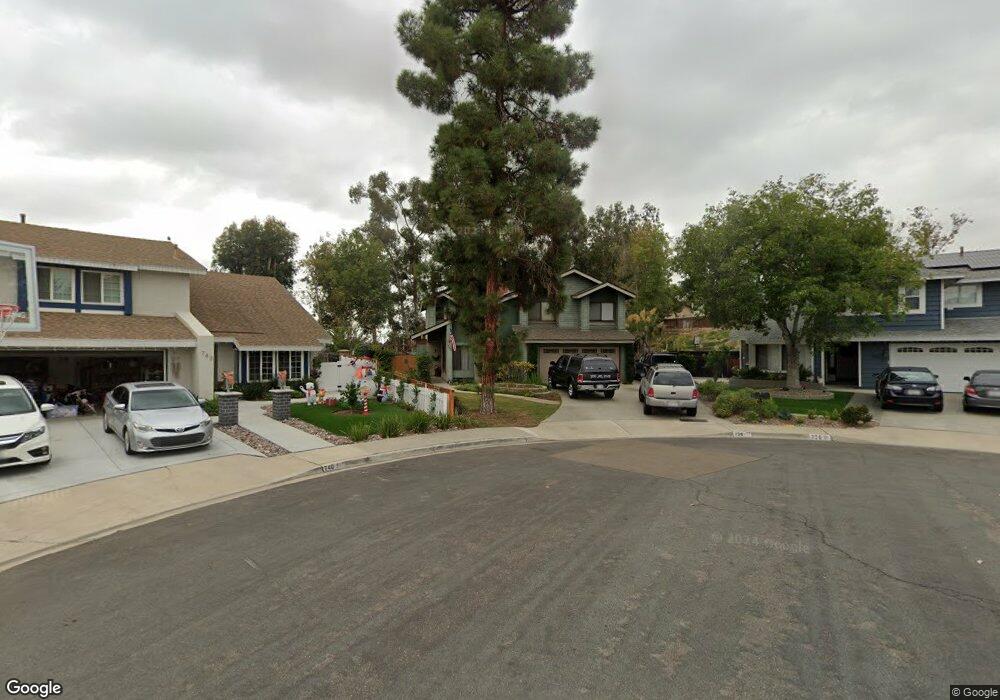
This home is located at 736 Arroyo Ct, Chula Vista, CA 91910 and is currently estimated at $1,039,113, approximately $501 per square foot. 736 Arroyo Ct is a home located in San Diego County with nearby schools including Casillas Elementary School, Rancho Del Rey Middle School, and Otay Ranch Senior High School.
Ownership History
We collect this data history from publicly available records. To have your information removed, we recommend requesting removal directly through your county’s website.
Purchase Details
Home Financials for this Owner
Home Financials are based on the most recent Mortgage that was taken out on this home.Home Values in the Area
Average Home Value in this Area
Purchase History
We collect this data history from publicly available records. To have your information removed, we recommend requesting removal directly through your county’s website.
| Date | Buyer | Sale Price | Title Company |
|---|---|---|---|
| $233,000 | Fidelity National Title |
Mortgage History
We collect this data history from publicly available records. To have your information removed, we recommend requesting removal directly through your county’s website.
| Date | Status | Borrower | Loan Amount |
|---|---|---|---|
| Open | $209,700 |
Tax History
We collect this data history from publicly available records. To have your information removed, we recommend requesting removal directly through your county’s website.
| Year | Tax Paid | Tax Assessment Tax Assessment Total Assessment is a certain percentage of the fair market value that is determined by local assessors to be the total taxable value of land and additions on the property. | Land | Improvement |
|---|---|---|---|---|
| 2025 | $5,086 | $427,096 | $143,697 | $283,399 |
| 2024 | $5,086 | $418,723 | $140,880 | $277,843 |
| 2023 | $5,011 | $410,514 | $138,118 | $272,396 |
| 2022 | $4,863 | $402,465 | $135,410 | $267,055 |
| 2021 | $4,753 | $394,574 | $132,755 | $261,819 |
| 2020 | $4,640 | $390,529 | $131,394 | $259,135 |
| 2019 | $4,520 | $382,872 | $128,818 | $254,054 |
| 2018 | $4,446 | $375,366 | $126,293 | $249,073 |
| 2017 | $4,350 | $368,007 | $123,817 | $244,190 |
| 2016 | $4,248 | $360,792 | $121,390 | $239,402 |
| 2015 | $4,187 | $355,373 | $119,567 | $235,806 |
| 2014 | $4,116 | $348,412 | $117,225 | $231,187 |
Map
- 756 Roca Rd
- 712 Paseo Del Rey
- 1008 Calma Dr
- 682 Calma Place
- 902 Loma View
- 0 Old Telegraph Canyon Rd
- 705 Paso de Luz Unit 201
- 637 Tiffany Ct
- 1008 Red Oak Place
- 576 Douglas St
- 843 Caminito Las Olas
- 582 Manzanita St
- 485 Montcalm St
- 625 E J St
- 1162 Ocelot Ave
- 525 Manzanita St
- 623 Alber St
- 784 Mateo St Unit 1
- 1041 Paseo Del Norte
- 444 E Oxford St
Ask me questions while you tour the home.