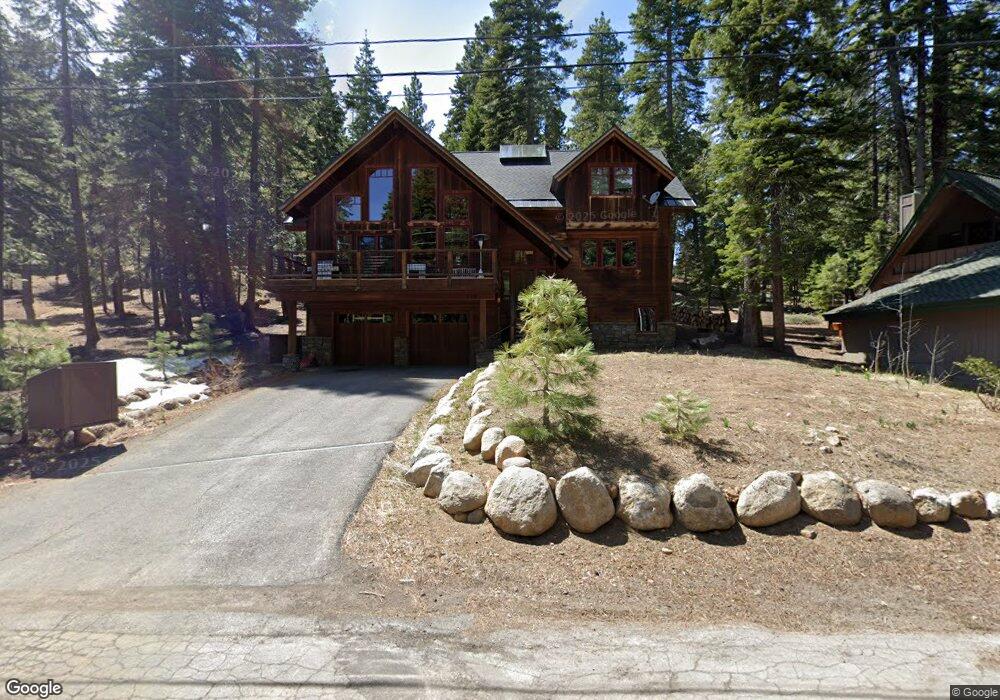
736 Chapel Ln Tahoe City, CA 96145
Estimated Value: $1,149,000 - $2,085,881
4
Beds
4
Baths
3,673
Sq Ft
$434/Sq Ft
Est. Value
About This Home
This home is located at 736 Chapel Ln, Tahoe City, CA 96145 and is currently estimated at $1,595,220, approximately $434 per square foot. 736 Chapel Ln is a home with nearby schools including Tahoe Lake Elementary School, North Tahoe School, and North Tahoe High School.
Ownership History
Date
Name
Owned For
Owner Type
Purchase Details
Closed on
Nov 14, 2012
Sold by
Row Charles M
Bought by
Holland Row Charles M and Holland Row Carolin
Current Estimated Value
Home Financials for this Owner
Home Financials are based on the most recent Mortgage that was taken out on this home.
Original Mortgage
$182,400
Outstanding Balance
$125,803
Interest Rate
3.35%
Mortgage Type
New Conventional
Estimated Equity
$1,469,417
Purchase Details
Closed on
Mar 21, 1998
Sold by
Locke Gilbert E and Locke Lynda
Bought by
Row Charles M
Home Financials for this Owner
Home Financials are based on the most recent Mortgage that was taken out on this home.
Original Mortgage
$151,200
Interest Rate
6.87%
Purchase Details
Closed on
Sep 2, 1994
Sold by
Dykes B R and Dykes Diana M
Bought by
Locke Gilbert E and Locke Lynda
Home Financials for this Owner
Home Financials are based on the most recent Mortgage that was taken out on this home.
Original Mortgage
$125,000
Interest Rate
6.75%
Create a Home Valuation Report for This Property
The Home Valuation Report is an in-depth analysis detailing your home's value as well as a comparison with similar homes in the area
Home Values in the Area
Average Home Value in this Area
Purchase History
| Date | Buyer | Sale Price | Title Company |
|---|---|---|---|
| Holland Row Charles M | -- | Chicago Title Insurance Comp | |
| Row Charles M | $189,000 | Fidelity National Title Co | |
| Locke Gilbert E | $157,000 | Placer Title Company |
Source: Public Records
Mortgage History
| Date | Status | Borrower | Loan Amount |
|---|---|---|---|
| Open | Holland Row Charles M | $182,400 | |
| Closed | Row Charles M | $151,200 | |
| Previous Owner | Locke Gilbert E | $125,000 |
Source: Public Records
Tax History Compared to Growth
Tax History
| Year | Tax Paid | Tax Assessment Tax Assessment Total Assessment is a certain percentage of the fair market value that is determined by local assessors to be the total taxable value of land and additions on the property. | Land | Improvement |
|---|---|---|---|---|
| 2025 | $8,422 | $724,733 | $75,031 | $649,702 |
| 2023 | $8,422 | $696,592 | $72,118 | $624,474 |
| 2022 | $8,120 | $682,934 | $70,704 | $612,230 |
| 2021 | $7,820 | $669,544 | $69,318 | $600,226 |
| 2020 | $7,823 | $662,680 | $68,608 | $594,072 |
| 2019 | $7,897 | $649,687 | $67,263 | $582,424 |
| 2018 | $7,383 | $636,949 | $65,945 | $571,004 |
| 2017 | $7,242 | $624,460 | $64,652 | $559,808 |
| 2016 | $7,161 | $612,217 | $63,385 | $548,832 |
| 2015 | $7,018 | $603,022 | $62,433 | $540,589 |
| 2014 | $6,815 | $592,981 | $61,211 | $531,770 |
Source: Public Records
Map
Nearby Homes
- 712 Chapel Ln
- 735 Silverado Dr
- 725 Granlibakken Rd Unit 24
- 300 W Lake Blvd Unit 84
- 1195 Sequoia Ave
- 1263 Sequoia Ave
- 6245 W River Rd Unit 9
- 1254 W Lake Blvd
- 358 Twin Crags Rd
- 1370 Sequoia Ave
- 280 Tahoe Woods Blvd Unit 1
- 1105 W Lake Blvd
- 1350 W Lake Blvd
- 1460 Tahoe Park Heights Dr
- 240 Eastview Dr
- 250 Eastview Dr
- 1733 Tahoe Park Heights Dr
- 920 Snowshoe Rd
- 265 Tamarack Ln
- 1884 Tahoe Park Heights Dr