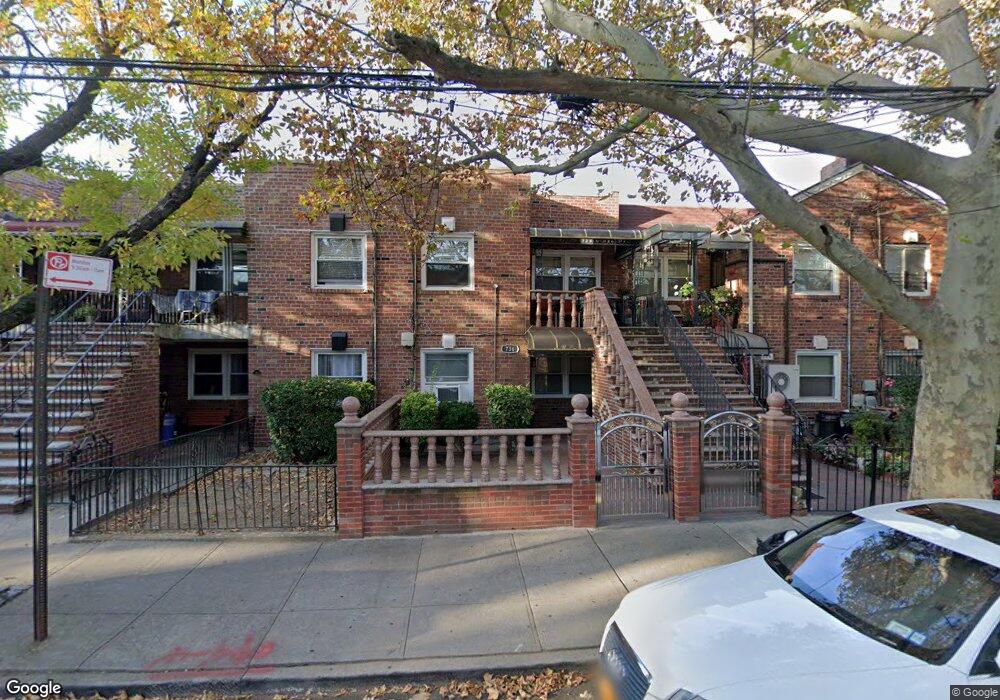
736 E 81st St Brooklyn, NY 11236
Canarsie NeighborhoodEstimated Value: $767,000 - $967,000
Studio
--
Bath
1,720
Sq Ft
$493/Sq Ft
Est. Value
About This Home
This home is located at 736 E 81st St, Brooklyn, NY 11236 and is currently estimated at $848,717, approximately $493 per square foot. 736 E 81st St is a home located in Kings County with nearby schools including P.S. 276 Louis Marshall, Is 68 Isaac Bildersee, and Explore Excel Charter School.
Ownership History
Date
Name
Owned For
Owner Type
Purchase Details
Closed on
Feb 1, 2024
Sold by
Bourne Linda
Bought by
Bourne-Dublin Linda and Marshall Brenda R
Current Estimated Value
Home Financials for this Owner
Home Financials are based on the most recent Mortgage that was taken out on this home.
Original Mortgage
$501,000
Outstanding Balance
$491,539
Interest Rate
6.82%
Mortgage Type
Purchase Money Mortgage
Estimated Equity
$357,178
Purchase Details
Closed on
Feb 7, 2003
Sold by
Integrity Home Sales Llc
Bought by
Bourne Linda
Purchase Details
Closed on
Sep 4, 2002
Sold by
Taylor Janice E Referee
Bought by
Integrity Home Sales Llc
Create a Home Valuation Report for This Property
The Home Valuation Report is an in-depth analysis detailing your home's value as well as a comparison with similar homes in the area
Home Values in the Area
Average Home Value in this Area
Purchase History
| Date | Buyer | Sale Price | Title Company |
|---|---|---|---|
| Bourne-Dublin Linda | -- | -- | |
| Bourne-Dublin Linda | -- | -- | |
| Bourne-Dublin Linda | -- | -- | |
| Bourne Linda | $376,000 | -- | |
| Bourne Linda | $376,000 | -- | |
| Integrity Home Sales Llc | -- | -- | |
| Integrity Home Sales Llc | -- | -- |
Source: Public Records
Mortgage History
| Date | Status | Borrower | Loan Amount |
|---|---|---|---|
| Open | Bourne-Dublin Linda | $501,000 | |
| Closed | Bourne-Dublin Linda | $501,000 | |
| Closed | Bourne Linda | $0 |
Source: Public Records
Tax History
| Year | Tax Paid | Tax Assessment Tax Assessment Total Assessment is a certain percentage of the fair market value that is determined by local assessors to be the total taxable value of land and additions on the property. | Land | Improvement |
|---|---|---|---|---|
| 2025 | $6,143 | $41,820 | $10,440 | $31,380 |
| 2024 | $6,143 | $47,940 | $10,440 | $37,500 |
| 2023 | $6,165 | $50,040 | $10,440 | $39,600 |
| 2022 | $5,717 | $42,900 | $10,440 | $32,460 |
| 2021 | $5,686 | $36,720 | $10,440 | $26,280 |
| 2020 | $2,666 | $39,180 | $10,440 | $28,740 |
| 2019 | $5,332 | $37,800 | $10,440 | $27,360 |
| 2018 | $5,156 | $25,295 | $6,173 | $19,122 |
| 2017 | $4,865 | $23,864 | $8,561 | $15,303 |
| 2016 | $4,501 | $22,514 | $8,195 | $14,319 |
| 2015 | $3,138 | $21,240 | $8,700 | $12,540 |
| 2014 | $3,138 | $21,240 | $8,700 | $12,540 |
Source: Public Records
Map
Nearby Homes
Your Personal Tour Guide
Ask me questions while you tour the home.