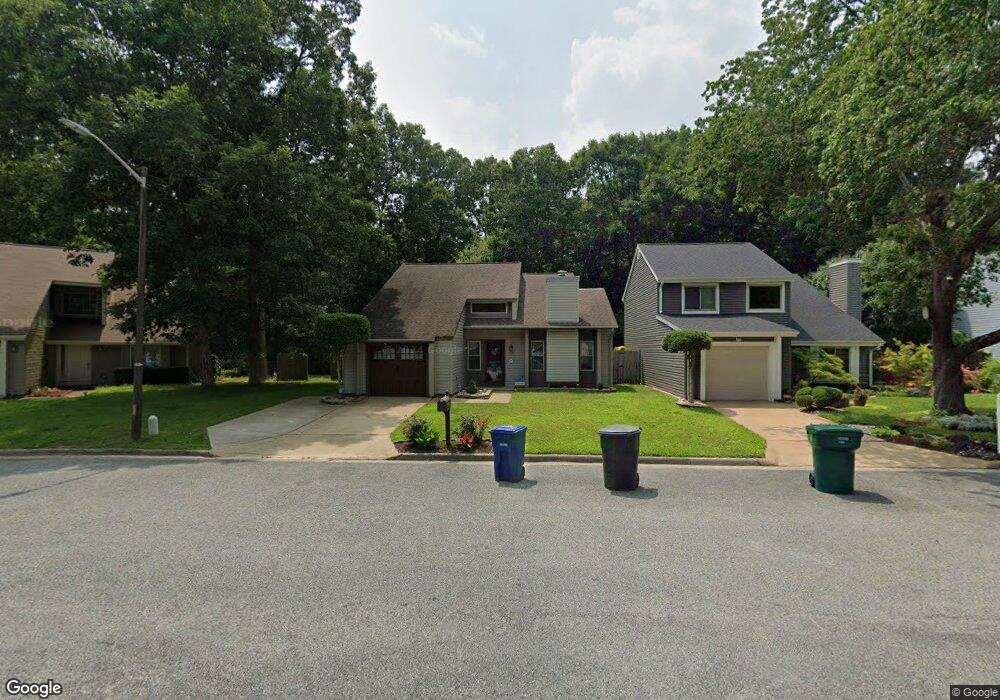
736 Longleaf Ln Newport News, VA 23608
Greenwood NeighborhoodEstimated Value: $284,000 - $297,597
3
Beds
2
Baths
1,454
Sq Ft
$198/Sq Ft
Est. Value
About This Home
This home is located at 736 Longleaf Ln, Newport News, VA 23608 and is currently estimated at $288,149, approximately $198 per square foot. 736 Longleaf Ln is a home located in Newport News City with nearby schools including Oliver C. Greenwood Elementary School, Ella Fitzgerald Middle School, and Woodside High School.
Ownership History
Date
Name
Owned For
Owner Type
Purchase Details
Closed on
Jun 30, 2020
Sold by
Hillard Cedric T and Hillard Deborah G
Bought by
Rekun Anton and Rekun Tetiana V
Current Estimated Value
Home Financials for this Owner
Home Financials are based on the most recent Mortgage that was taken out on this home.
Original Mortgage
$172,800
Outstanding Balance
$153,228
Interest Rate
3.1%
Mortgage Type
New Conventional
Estimated Equity
$134,921
Purchase Details
Closed on
Jun 18, 2007
Sold by
Stout Shannon T
Bought by
Hillard Cedric T and Hillard,Deborah G
Home Financials for this Owner
Home Financials are based on the most recent Mortgage that was taken out on this home.
Original Mortgage
$214,515
Interest Rate
6.5%
Mortgage Type
VA
Purchase Details
Closed on
Jan 29, 2004
Sold by
Watson Raymond A
Bought by
Stout Shannon T
Home Financials for this Owner
Home Financials are based on the most recent Mortgage that was taken out on this home.
Original Mortgage
$121,618
Interest Rate
5.8%
Mortgage Type
VA
Create a Home Valuation Report for This Property
The Home Valuation Report is an in-depth analysis detailing your home's value as well as a comparison with similar homes in the area
Home Values in the Area
Average Home Value in this Area
Purchase History
| Date | Buyer | Sale Price | Title Company |
|---|---|---|---|
| Rekun Anton | $192,000 | Attorney | |
| Hillard Cedric T | $210,000 | -- | |
| Stout Shannon T | $119,000 | -- |
Source: Public Records
Mortgage History
| Date | Status | Borrower | Loan Amount |
|---|---|---|---|
| Open | Rekun Anton | $172,800 | |
| Previous Owner | Hillard Cedric T | $214,515 | |
| Previous Owner | Stout Shannon T | $121,618 |
Source: Public Records
Tax History Compared to Growth
Tax History
| Year | Tax Paid | Tax Assessment Tax Assessment Total Assessment is a certain percentage of the fair market value that is determined by local assessors to be the total taxable value of land and additions on the property. | Land | Improvement |
|---|---|---|---|---|
| 2024 | $3,158 | $267,600 | $60,500 | $207,100 |
| 2023 | $3,305 | $267,600 | $60,500 | $207,100 |
| 2022 | $3,119 | $247,700 | $60,500 | $187,200 |
| 2021 | $2,524 | $206,900 | $55,000 | $151,900 |
| 2020 | $2,331 | $179,000 | $55,000 | $124,000 |
| 2019 | $2,326 | $179,000 | $55,000 | $124,000 |
| 2018 | $2,224 | $170,900 | $55,000 | $115,900 |
| 2017 | $2,196 | $168,600 | $55,000 | $113,600 |
| 2016 | $2,192 | $168,600 | $55,000 | $113,600 |
| 2015 | $2,113 | $164,200 | $55,000 | $109,200 |
| 2014 | $1,968 | $168,700 | $55,000 | $113,700 |
Source: Public Records
Map
Nearby Homes
- 828 Chapin Wood Dr
- 235 Whitewater Dr
- 210 Whitewater Dr
- 735 Trails Ln
- 699 Trails Ln
- 109 Tack Ct
- 607 Barbara Ct
- 300 Jacks Place
- 13630 Woodside Ln
- 545 Settlement Ln
- 613 Cristal Dr
- 499 Old Colonial Way
- 331 Judy Dr
- 306 Wythe St
- 481 Lees Mill Dr
- 469 Revolution Ln
- 408 Rivers Ridge Cir
- 396 Rivers Ridge Cir
- 377 Lees Mill Dr
- 364 Rivers Ridge Cir
- 734 Longleaf Ln
- 738 Longleaf Ln
- 732 Longleaf Ln
- 740 Longleaf Ln
- 729 Longleaf Ln
- 739 Longleaf Ln
- 730 Longleaf Ln
- 731 Longleaf Ln
- 638 Old Fort Eustis Blvd
- 737 Longleaf Ln
- 733 Longleaf Ln
- 735 Longleaf Ln
- 723 Longleaf Ln
- 728 Longleaf Ln
- 722 Ninebark Ct
- 723 Ninebark Ct
- 726 Longleaf Ln
- 720 Ninebark Ct
- 634 Old Fort Eustis Blvd
- 721 Longleaf Ln