Estimated Value: $1,491,323
--
Bed
--
Bath
13,824
Sq Ft
$108/Sq Ft
Est. Value
About This Home
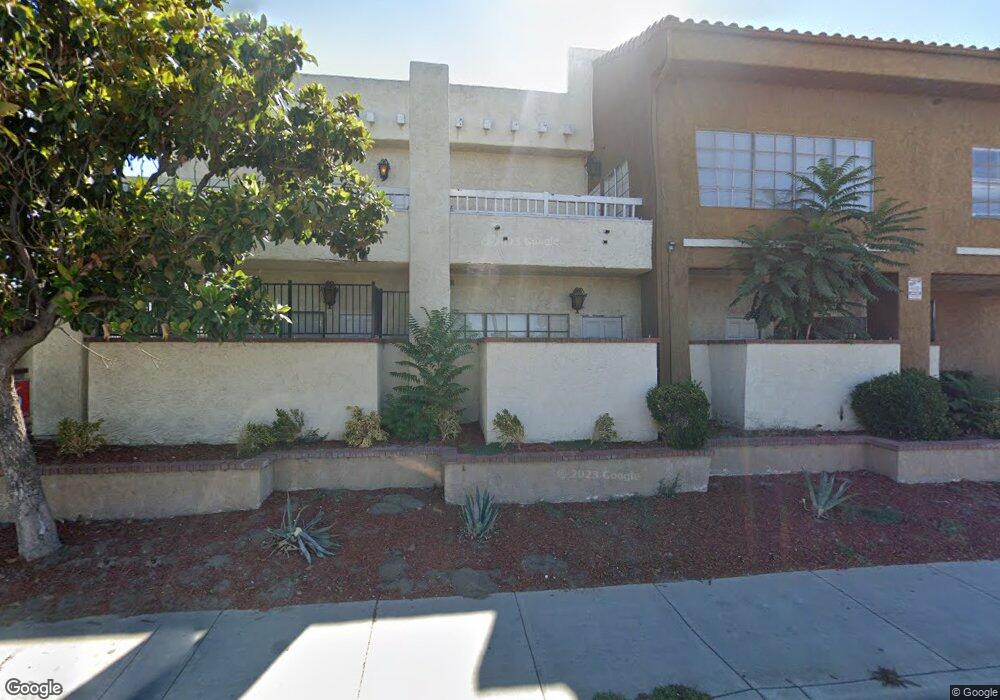
This home is located at 736 N State St, Hemet, CA 92543 and is currently estimated at $1,491,323, approximately $107 per square foot. 736 N State St is a home located in Riverside County with nearby schools including Park Hill Elementary School, North Mountain Middle School, and San Jacinto High School.
Ownership History
Date
Name
Owned For
Owner Type
Purchase Details
Closed on
Jun 22, 2020
Sold by
Tyni Matt and Tyni Janice S
Bought by
Everymarket Inc
Current Estimated Value
Home Financials for this Owner
Home Financials are based on the most recent Mortgage that was taken out on this home.
Original Mortgage
$487,500
Interest Rate
3%
Mortgage Type
Credit Line Revolving
Purchase Details
Closed on
Feb 24, 2004
Sold by
Tyni Matt and Tyni Janice S
Bought by
Tyni Matt and Tyni Janice S
Purchase Details
Closed on
Mar 11, 2002
Sold by
The Wong Rlt
Bought by
Tyni Matt and Tyni Janice
Purchase Details
Closed on
May 21, 2001
Sold by
Tlc America Inc
Bought by
Tyni Matt and Tyni Janice
Home Financials for this Owner
Home Financials are based on the most recent Mortgage that was taken out on this home.
Original Mortgage
$275,000
Interest Rate
7.21%
Mortgage Type
Commercial
Purchase Details
Closed on
Jan 26, 2000
Sold by
Tlc America Inc
Bought by
The Wong Rlt
Purchase Details
Closed on
Sep 28, 1999
Sold by
Regency Svgs Bank Fsb
Bought by
Tlc America Inc
Purchase Details
Closed on
Jul 9, 1998
Sold by
State Street Assoc
Bought by
Regency Svgs Bank Fsb
Create a Home Valuation Report for This Property
The Home Valuation Report is an in-depth analysis detailing your home's value as well as a comparison with similar homes in the area
Home Values in the Area
Average Home Value in this Area
Purchase History
| Date | Buyer | Sale Price | Title Company |
|---|---|---|---|
| Everymarket Inc | $975,000 | First Amer Ttl Ins Co Natl C | |
| Tyni Matt | -- | -- | |
| Tyni Matt | -- | -- | |
| Tyni Matt | $550,000 | United Title | |
| The Wong Rlt | -- | -- | |
| Tlc America Inc | $425,000 | Stewart Title | |
| Regency Svgs Bank Fsb | $423,000 | Chicago Title Co |
Source: Public Records
Mortgage History
| Date | Status | Borrower | Loan Amount |
|---|---|---|---|
| Previous Owner | Everymarket Inc | $487,500 | |
| Previous Owner | Tyni Matt | $275,000 |
Source: Public Records
Tax History Compared to Growth
Tax History
| Year | Tax Paid | Tax Assessment Tax Assessment Total Assessment is a certain percentage of the fair market value that is determined by local assessors to be the total taxable value of land and additions on the property. | Land | Improvement |
|---|---|---|---|---|
| 2025 | $12,111 | $1,055,370 | $324,729 | $730,641 |
| 2023 | $12,111 | $1,014,390 | $312,120 | $702,270 |
| 2022 | $11,825 | $994,500 | $306,000 | $688,500 |
| 2021 | $11,627 | $975,000 | $300,000 | $675,000 |
| 2020 | $7,223 | $597,261 | $210,795 | $386,466 |
| 2019 | $7,086 | $585,551 | $206,662 | $378,889 |
| 2018 | $6,952 | $574,070 | $202,610 | $371,460 |
| 2017 | $6,808 | $562,815 | $198,638 | $364,177 |
| 2016 | $6,491 | $551,781 | $194,744 | $357,037 |
| 2015 | $6,405 | $543,495 | $191,820 | $351,675 |
| 2014 | $6,217 | $532,850 | $188,063 | $344,787 |
Source: Public Records
Map
Nearby Homes
- 860 Polk Ct
- 25180 N Buena Vista St
- 876 Aria Rd
- 520 Kit Ave
- 769 Harding St
- 308 Bristolwood Rd
- 641 Kit Ave
- 671 Greystone Ln
- 931 Donner St
- 459 N Taylor St
- 675 W Oakland Ave Unit A-4
- 675 W Oakland Ave Unit G2
- 675 W Oakland Ave Unit A9
- 642 N Santa fe St
- 681 Taschner Dr
- 627 Glenn Way
- 401 N Santa fe St
- 430 N Palm Ave Unit 7
- 430 N Palm Ave
- 430 N Palm Ave Unit 70
- 736 N State St Unit 1750 & 576
- 772 N State St
- 784 N State St
- 796 N State St
- 703 N State St
- 685 N State St
- 160 W Menlo Ave
- 761 N State St
- 824 N State St
- 257259 N State St
- 211 W Menlo Ave
- 805 Roxanne Dr
- 785 N State St
- 275 E Menlo Ave
- 815 Roxanne Dr
- 821 Roxanne Dr
- 837 Roxanne Dr
- 804 Roxanne Dr
- 843 Roxanne Dr
- 0 N State St Unit HM13072476