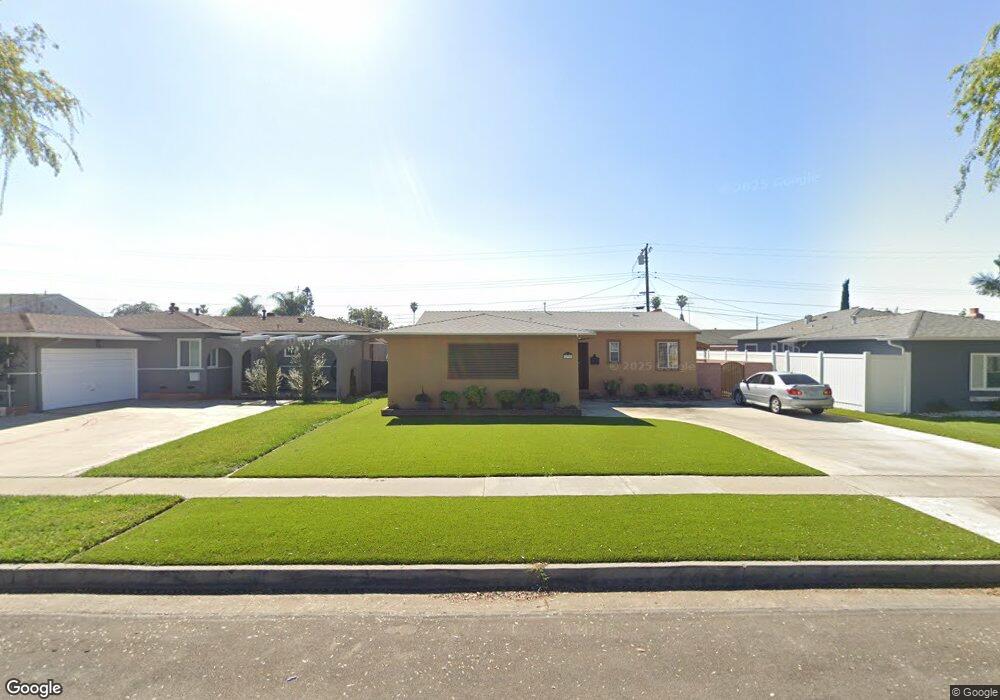
736 W Woodcrest Ave Fullerton, CA 92832
Estimated Value: $807,000 - $850,243
3
Beds
2
Baths
1,109
Sq Ft
$755/Sq Ft
Est. Value
About This Home
This home is located at 736 W Woodcrest Ave, Fullerton, CA 92832 and is currently estimated at $837,311, approximately $755 per square foot. 736 W Woodcrest Ave is a home located in Orange County with nearby schools including Woodcrest Elementary School, Nicolas Junior High School, and Fullerton Union High School.
Ownership History
Date
Name
Owned For
Owner Type
Purchase Details
Closed on
Feb 2, 2004
Sold by
Fitch Michael W and Fitch Lisa Michelle
Bought by
Torres Olga E
Current Estimated Value
Home Financials for this Owner
Home Financials are based on the most recent Mortgage that was taken out on this home.
Original Mortgage
$301,600
Outstanding Balance
$139,285
Interest Rate
5.61%
Mortgage Type
Purchase Money Mortgage
Estimated Equity
$698,026
Purchase Details
Closed on
Oct 20, 1993
Sold by
Nelson Gregory J and Nelson Maria Salcido
Bought by
Fitch Michael W and Fitch Lisa Michelle
Home Financials for this Owner
Home Financials are based on the most recent Mortgage that was taken out on this home.
Original Mortgage
$153,161
Interest Rate
5%
Mortgage Type
FHA
Create a Home Valuation Report for This Property
The Home Valuation Report is an in-depth analysis detailing your home's value as well as a comparison with similar homes in the area
Home Values in the Area
Average Home Value in this Area
Purchase History
| Date | Buyer | Sale Price | Title Company |
|---|---|---|---|
| Torres Olga E | $390,000 | Southland Title Corporation | |
| Fitch Michael W | $155,500 | Gateway Title Company |
Source: Public Records
Mortgage History
| Date | Status | Borrower | Loan Amount |
|---|---|---|---|
| Open | Torres Olga E | $301,600 | |
| Previous Owner | Fitch Michael W | $153,161 | |
| Closed | Torres Olga E | $49,400 |
Source: Public Records
Tax History Compared to Growth
Tax History
| Year | Tax Paid | Tax Assessment Tax Assessment Total Assessment is a certain percentage of the fair market value that is determined by local assessors to be the total taxable value of land and additions on the property. | Land | Improvement |
|---|---|---|---|---|
| 2025 | $6,116 | $554,492 | $491,542 | $62,950 |
| 2024 | $6,116 | $543,620 | $481,904 | $61,716 |
| 2023 | $5,967 | $532,961 | $472,455 | $60,506 |
| 2022 | $5,926 | $522,511 | $463,191 | $59,320 |
| 2021 | $5,822 | $512,266 | $454,109 | $58,157 |
| 2020 | $5,790 | $507,014 | $449,453 | $57,561 |
| 2019 | $5,638 | $497,073 | $440,640 | $56,433 |
| 2018 | $5,552 | $487,327 | $432,000 | $55,327 |
| 2017 | $5,459 | $477,772 | $423,529 | $54,243 |
| 2016 | $5,297 | $464,000 | $415,224 | $48,776 |
| 2015 | $4,860 | $430,000 | $382,068 | $47,932 |
| 2014 | $4,106 | $363,600 | $315,668 | $47,932 |
Source: Public Records
Map
Nearby Homes
- 654 W Gage Ave
- 1506 S Euclid St
- 1613 S Roosevelt Ave
- 601 W Southgate Ave
- 540 W Knepp Ave
- 442 W Porter Ave
- 1512 S Lovering Ave
- 1519 S Lovering Ave
- 718 S Euclid St
- 1137 W Porter Ave
- 1148 W Porter Ave
- 443 W Southgate Ave
- 340 Via Amor Place
- 530 W Elm Ave
- 700 S Orange Ave
- 616 W Ash Ave
- 430 W Knepp Ave
- 1206 W Porter Ave
- 425 W Knepp Ave
- 230 W Knepp Ave
- 730 W Woodcrest Ave
- 742 W Woodcrest Ave
- 737 W Gage Ave
- 724 W Woodcrest Ave
- 748 W Woodcrest Ave
- 731 W Gage Ave
- 743 W Gage Ave
- 749 W Gage Ave
- 725 W Gage Ave
- 737 W Woodcrest Ave
- 743 W Woodcrest Ave
- 731 W Woodcrest Ave Unit 1627
- 718 W Woodcrest Ave
- 754 W Woodcrest Ave
- 749 W Woodcrest Ave
- 725 W Woodcrest Ave
- 719 W Gage Ave
- 755 W Gage Ave
- 712 W Woodcrest Ave
- 760 W Woodcrest Ave