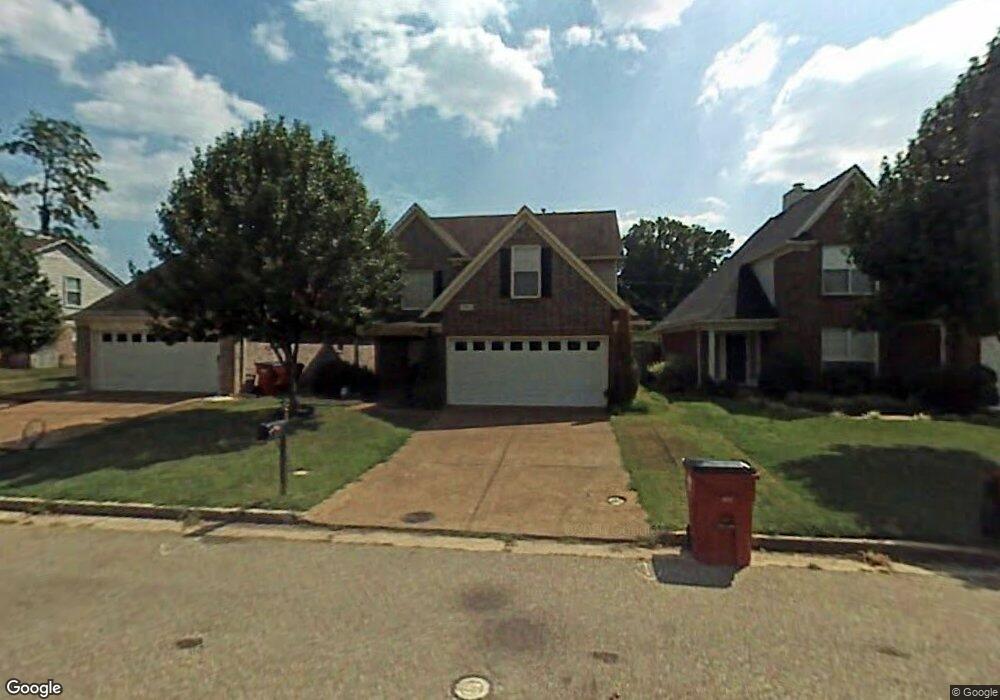
7361 Appling Ridge Dr Cordova, TN 38018
Cordova NeighborhoodEstimated Value: $234,000 - $257,000
3
Beds
3
Baths
1,789
Sq Ft
$137/Sq Ft
Est. Value
About This Home
This home is located at 7361 Appling Ridge Dr, Cordova, TN 38018 and is currently estimated at $244,530, approximately $136 per square foot. 7361 Appling Ridge Dr is a home located in Shelby County with nearby schools including Dexter Elementary School, Dexter Middle School, and Cordova High School.
Ownership History
Date
Name
Owned For
Owner Type
Purchase Details
Closed on
Jul 9, 2018
Sold by
Camarena Genaro
Bought by
Cruz Jose M
Current Estimated Value
Home Financials for this Owner
Home Financials are based on the most recent Mortgage that was taken out on this home.
Original Mortgage
$145,500
Outstanding Balance
$125,568
Interest Rate
4.5%
Mortgage Type
New Conventional
Estimated Equity
$118,962
Purchase Details
Closed on
Oct 16, 2006
Sold by
Brown Lorenzo
Bought by
Camarena Genaro
Home Financials for this Owner
Home Financials are based on the most recent Mortgage that was taken out on this home.
Original Mortgage
$105,600
Interest Rate
5.87%
Mortgage Type
Purchase Money Mortgage
Purchase Details
Closed on
Dec 18, 1998
Sold by
Lagonia Sherman Llc
Bought by
Brown Lorenzo
Home Financials for this Owner
Home Financials are based on the most recent Mortgage that was taken out on this home.
Original Mortgage
$119,580
Interest Rate
6.87%
Mortgage Type
FHA
Create a Home Valuation Report for This Property
The Home Valuation Report is an in-depth analysis detailing your home's value as well as a comparison with similar homes in the area
Home Values in the Area
Average Home Value in this Area
Purchase History
| Date | Buyer | Sale Price | Title Company |
|---|---|---|---|
| Cruz Jose M | $150,000 | Quality Title Group Llc | |
| Camarena Genaro | $132,000 | West Tennessee Title Company | |
| Brown Lorenzo | $119,750 | Southern Escrow Title Compan | |
| Brown Lorenzo | $119,750 | Southern Escrow Title Compan |
Source: Public Records
Mortgage History
| Date | Status | Borrower | Loan Amount |
|---|---|---|---|
| Open | Cruz Jose M | $145,500 | |
| Previous Owner | Camarena Genaro | $105,600 | |
| Previous Owner | Brown Lorenzo | $119,580 |
Source: Public Records
Tax History Compared to Growth
Tax History
| Year | Tax Paid | Tax Assessment Tax Assessment Total Assessment is a certain percentage of the fair market value that is determined by local assessors to be the total taxable value of land and additions on the property. | Land | Improvement |
|---|---|---|---|---|
| 2025 | $1,579 | $65,000 | $11,750 | $53,250 |
| 2024 | $1,579 | $46,575 | $7,500 | $39,075 |
| 2023 | $1,579 | $46,575 | $7,500 | $39,075 |
| 2022 | $1,579 | $46,575 | $7,500 | $39,075 |
| 2021 | $1,607 | $46,575 | $7,500 | $39,075 |
| 2020 | $1,309 | $32,325 | $7,500 | $24,825 |
| 2019 | $1,309 | $32,325 | $7,500 | $24,825 |
| 2018 | $1,309 | $32,325 | $7,500 | $24,825 |
| 2017 | $1,329 | $32,325 | $7,500 | $24,825 |
| 2016 | $1,371 | $31,375 | $0 | $0 |
| 2014 | $1,371 | $31,375 | $0 | $0 |
Source: Public Records
Map
Nearby Homes
- 7468 Links View Ln S
- 1089 Links View Ln W
- 873 Winterfields Dr
- 887 Dalemore Ln
- 7420 Dal Whinnie Trail
- 7303 Winterbrook Ln
- 7494 Links View Ln S
- 7247 Winterbrook Ln
- 7486 Dal Whinnie Trail
- 7194 Charlton Way
- 7565 Wintergreen Ln
- 1277 Winter Springs Ln
- 6990 Parkbrook Ln
- 1321 Winter Springs Ln
- 7520 Crystal Lake Dr
- 7776 Grey Squirrel Cove
- 1218 Cordova Green Dr
- 7801 Autumn Creek Dr
- 7412 Lost Trail Dr
- 7426 Lost Trail Dr
- 7357 Appling Ridge Dr
- 7365 Appling Ridge Dr
- 7371 Appling Ridge Dr
- 7353 Appling Ridge Dr
- 7349 Appling Ridge Dr
- 981 Appling Meadow Dr
- 7370 Appling Ridge Dr
- 7375 Appling Ridge Dr
- 7379 Appling Ridge Dr
- 7343 Appling Ridge Dr
- 987 Appling Meadow Dr
- 990 Appling Meadow Dr
- 7344 Appling Ridge Dr
- 7339 Appling Ridge Dr
- 7376 Macon Rd
- 7383 Appling Ridge Dr
- 993 Appling Meadow Dr
- 971 Crayton Ridge Dr
- 996 Appling Meadow Dr
- 7340 Appling Ridge Dr