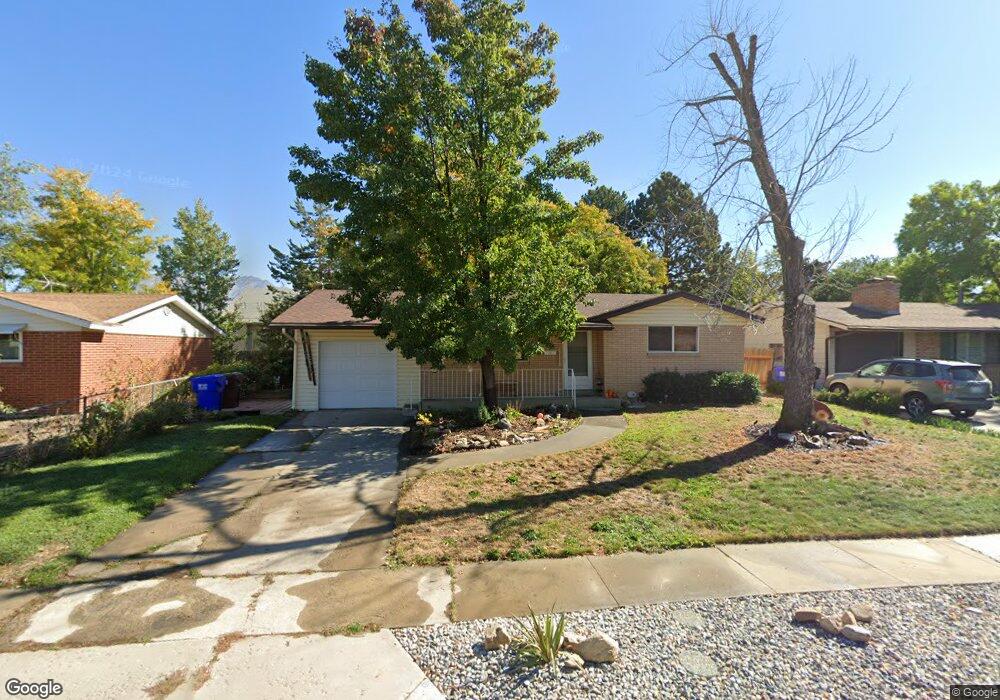
7363 Layne Dr Midvale, UT 84047
Estimated Value: $480,761 - $541,000
4
Beds
2
Baths
942
Sq Ft
$539/Sq Ft
Est. Value
About This Home
This home is located at 7363 Layne Dr, Midvale, UT 84047 and is currently estimated at $507,940, approximately $539 per square foot. 7363 Layne Dr is a home located in Salt Lake County with nearby schools including Midvalley Elementary School, Hillcrest High School, and Midvale Middle School.
Ownership History
Date
Name
Owned For
Owner Type
Purchase Details
Closed on
Dec 18, 2020
Sold by
Betz Christina L and The Christina I Lang Trust
Bought by
Betz Christina I and The Christina I Betz Trust
Current Estimated Value
Purchase Details
Closed on
Aug 4, 2017
Sold by
Lang Christinea I
Bought by
Lang Christina L and The Christina I Lang Trust
Purchase Details
Closed on
Feb 4, 2016
Sold by
Jaynes Eggett Deborah Sue
Bought by
Lang Christina I
Home Financials for this Owner
Home Financials are based on the most recent Mortgage that was taken out on this home.
Original Mortgage
$192,850
Interest Rate
3.93%
Mortgage Type
New Conventional
Purchase Details
Closed on
Oct 12, 1995
Sold by
Sampson Leah Nora
Bought by
Sampson Leah Nora
Create a Home Valuation Report for This Property
The Home Valuation Report is an in-depth analysis detailing your home's value as well as a comparison with similar homes in the area
Home Values in the Area
Average Home Value in this Area
Purchase History
| Date | Buyer | Sale Price | Title Company |
|---|---|---|---|
| Betz Christina I | -- | None Available | |
| Lang Christina L | -- | None Available | |
| Lang Christina I | -- | Surety Title | |
| Sampson Leah Nora | -- | -- |
Source: Public Records
Mortgage History
| Date | Status | Borrower | Loan Amount |
|---|---|---|---|
| Previous Owner | Lang Christina I | $192,850 |
Source: Public Records
Tax History
| Year | Tax Paid | Tax Assessment Tax Assessment Total Assessment is a certain percentage of the fair market value that is determined by local assessors to be the total taxable value of land and additions on the property. | Land | Improvement |
|---|---|---|---|---|
| 2025 | $2,496 | $428,400 | $156,600 | $271,800 |
| 2024 | $2,496 | $409,800 | $147,000 | $262,800 |
| 2023 | $2,156 | $350,700 | $139,800 | $210,900 |
| 2022 | $2,263 | $359,700 | $137,100 | $222,600 |
| 2021 | $1,972 | $267,900 | $137,100 | $130,800 |
| 2020 | $1,924 | $247,400 | $91,500 | $155,900 |
| 2019 | $1,869 | $234,100 | $86,300 | $147,800 |
| 2016 | $1,707 | $201,600 | $86,300 | $115,300 |
Source: Public Records
Map
Nearby Homes
- 7377 S Ramanee Dr
- 7309 S Union Village Cir
- 7479 S Randall Cir
- 221 E Fort Union Blvd
- 7218 S Viansa Ct
- 106 E 7320 S
- 220 E Greenwood Ave
- 72 E 7320 S
- 7097 S 230 E
- 110 Greenwood Ave
- 7432 Green Berry Ct
- 7170 S 420 E
- 7187 S 420 E
- 387 E Villa Ct
- 7359 S Dewmar Ct W Unit 32
- 489 E 7800 S Unit 2
- 7363 S Dewmar Ct W Unit 33
- 7342 S Seven Tree Ln W Unit 77
- 7329 S Seven Tree Ln W Unit 85
- 7371 S Dewmar Ct W Unit 35
- 7363 S Layne Dr
- 7353 Layne Dr
- 7353 S Layne Dr
- 7373 Layne Dr
- 7373 S Layne Dr
- 7343 Layne Dr
- 7343 S Layne Dr
- 235 E 7350 S
- 219 E 7390 S
- 227 E 7390 S
- 7354 Layne Dr
- 7354 S Layne Dr
- 7366 Layne Dr
- 7344 S Layne Dr
- 7344 Layne Dr
- 7378 Layne Dr
- 7378 S Layne Dr
- 232 Carol Way
- 218 Carol Way Unit 220
- 236 E Carol Way
Your Personal Tour Guide
Ask me questions while you tour the home.