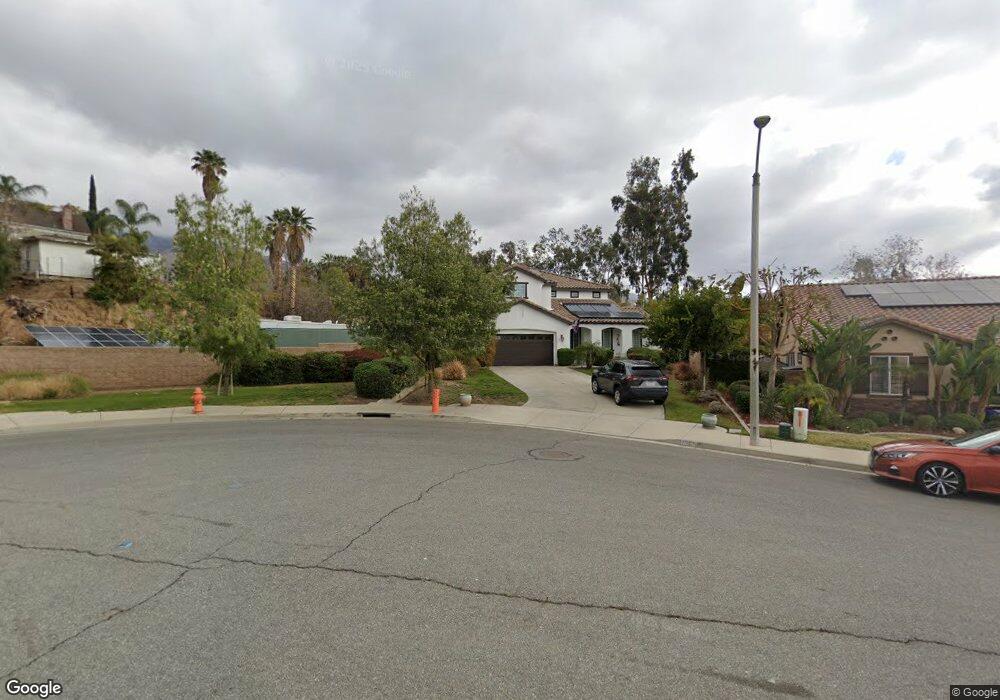
7365 Patterson Ct Highland, CA 92346
East Highlands NeighborhoodEstimated Value: $816,000 - $896,925
5
Beds
4
Baths
3,372
Sq Ft
$253/Sq Ft
Est. Value
About This Home
This home is located at 7365 Patterson Ct, Highland, CA 92346 and is currently estimated at $851,981, approximately $252 per square foot. 7365 Patterson Ct is a home located in San Bernardino County with nearby schools including Highland Grove Elementary School, Beattie Middle School, and Citrus Valley High School.
Ownership History
Date
Name
Owned For
Owner Type
Purchase Details
Closed on
Jul 6, 2011
Sold by
Wh Hidden Creek 11 Llc
Bought by
Cardoza Morrissa and Cardoza Adrian
Current Estimated Value
Home Financials for this Owner
Home Financials are based on the most recent Mortgage that was taken out on this home.
Original Mortgage
$375,240
Interest Rate
4.5%
Mortgage Type
FHA
Purchase Details
Closed on
Feb 19, 2010
Sold by
Wh Residential Venture 2009 Llc
Bought by
Wh Hidden Creek 11 Llc
Purchase Details
Closed on
Jul 1, 2009
Sold by
Williams Homes Inc
Bought by
Wh Residential Venture 2009 Llc
Purchase Details
Closed on
Apr 30, 2009
Sold by
Bank Of America National Association
Bought by
Williams Homes Inc
Purchase Details
Closed on
Jan 2, 2009
Sold by
Cf Highland I Llc
Bought by
Bank Of America Na
Create a Home Valuation Report for This Property
The Home Valuation Report is an in-depth analysis detailing your home's value as well as a comparison with similar homes in the area
Home Values in the Area
Average Home Value in this Area
Purchase History
| Date | Buyer | Sale Price | Title Company |
|---|---|---|---|
| Cardoza Morrissa | $385,000 | Chicago Title Company | |
| Wh Hidden Creek 11 Llc | -- | Chicago Title Company | |
| Wh Residential Venture 2009 Llc | $360,000 | Chicago Title Company | |
| Williams Homes Inc | -- | Fidelity National Title | |
| Bank Of America Na | $4,265,500 | Chicago Title Company |
Source: Public Records
Mortgage History
| Date | Status | Borrower | Loan Amount |
|---|---|---|---|
| Previous Owner | Cardoza Morrissa | $375,240 |
Source: Public Records
Tax History Compared to Growth
Tax History
| Year | Tax Paid | Tax Assessment Tax Assessment Total Assessment is a certain percentage of the fair market value that is determined by local assessors to be the total taxable value of land and additions on the property. | Land | Improvement |
|---|---|---|---|---|
| 2025 | $9,384 | $515,376 | $145,075 | $370,301 |
| 2024 | $9,384 | $505,270 | $142,230 | $363,040 |
| 2023 | $9,266 | $495,363 | $139,441 | $355,922 |
| 2022 | $9,086 | $485,650 | $136,707 | $348,943 |
| 2021 | $9,066 | $476,127 | $134,026 | $342,101 |
| 2020 | $8,882 | $471,245 | $132,652 | $338,593 |
| 2019 | $8,623 | $462,005 | $130,051 | $331,954 |
| 2018 | $8,339 | $452,946 | $127,501 | $325,445 |
| 2017 | $7,968 | $444,065 | $125,001 | $319,064 |
| 2016 | $7,573 | $415,750 | $122,551 | $293,199 |
| 2015 | $7,468 | $409,505 | $120,710 | $288,795 |
| 2014 | $7,223 | $394,483 | $118,345 | $276,138 |
Source: Public Records
Map
Nearby Homes
- 7265 Fletcher View Dr
- 28911 Willow Creek Ln
- 7466 Church St
- 7524 Sunny Ridge Loop
- 4040 4040 E Piedmont Unit 277
- 3520 Aurora Dr E
- 3552 Aurora Dr E
- 7126 Ridge Dr
- 7354 Harding Ct
- 7459 Melanie Ct
- 28947 Glenrock Place
- 29287 Silverfern Place
- 29154 Whitegate Ln
- 7214 Veranda Ln
- 0 Cloverhill Dr
- 7206 Veranda Ln
- 28780 Beattie St
- 7202 Veranda Ln
- 29136 Stonegate Ln
- 7196 Veranda Ln
- 7377 Patterson Ct
- 7324 Church St
- 7385 Patterson Ct
- 28841 Baseline St
- 28909 Baseline St
- 7382 Patterson Ct
- 7401 Patterson Ct
- 7394 Patterson Ct
- 7408 Patterson Ct
- 28881 Lemon St
- 7281 Fletcher View Dr
- 28807 Baseline St
- 7421 Santa fe Dr
- 7433 Santa fe Dr
- 28859 Hagy Ave
- 7271 Fletcher View Dr
- 28950 Elder Creek Ln
- 28873 Lemon St
- 28847 Hagy Ave
- 7414 Blue Creek Ln