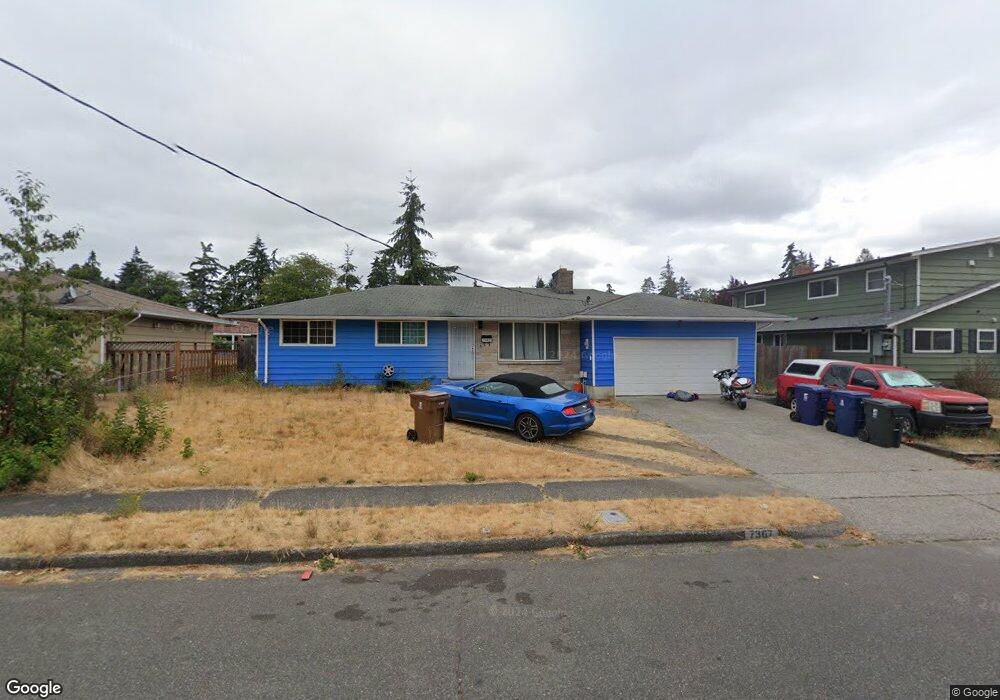
7367 S Wilkeson St Tacoma, WA 98408
South End NeighborhoodEstimated Value: $445,000 - $474,000
3
Beds
2
Baths
1,341
Sq Ft
$346/Sq Ft
Est. Value
About This Home
This home is located at 7367 S Wilkeson St, Tacoma, WA 98408 and is currently estimated at $463,709, approximately $345 per square foot. 7367 S Wilkeson St is a home located in Pierce County with nearby schools including Birney Elementary School, Baker Middle School, and Mount Tahoma High School.
Ownership History
Date
Name
Owned For
Owner Type
Purchase Details
Closed on
Jan 3, 2022
Sold by
Wilcox Mildred C
Bought by
Larson Christopher J and Wilcox Kassey Rose
Current Estimated Value
Home Financials for this Owner
Home Financials are based on the most recent Mortgage that was taken out on this home.
Original Mortgage
$0
Interest Rate
3.11%
Mortgage Type
New Conventional
Purchase Details
Closed on
Mar 30, 2010
Sold by
Blaksley George D
Bought by
Wilcox Mildred C
Home Financials for this Owner
Home Financials are based on the most recent Mortgage that was taken out on this home.
Original Mortgage
$182,139
Interest Rate
5.25%
Mortgage Type
FHA
Purchase Details
Closed on
Apr 24, 2009
Sold by
Jones Donald P and Jones Lori J
Bought by
Suess Herman A
Purchase Details
Closed on
Aug 30, 1996
Sold by
Bankers Trust Company
Bought by
Jones Donald P and Jones Lori J
Home Financials for this Owner
Home Financials are based on the most recent Mortgage that was taken out on this home.
Original Mortgage
$92,382
Interest Rate
8.2%
Mortgage Type
FHA
Create a Home Valuation Report for This Property
The Home Valuation Report is an in-depth analysis detailing your home's value as well as a comparison with similar homes in the area
Home Values in the Area
Average Home Value in this Area
Purchase History
| Date | Buyer | Sale Price | Title Company |
|---|---|---|---|
| Larson Christopher J | -- | Chicago Title | |
| Larson Christopher J | $261,500 | Chicago Title | |
| Wilcox Mildred C | $185,500 | Ticor | |
| Suess Herman A | $132,359 | None Available | |
| Jones Donald P | $92,500 | -- |
Source: Public Records
Mortgage History
| Date | Status | Borrower | Loan Amount |
|---|---|---|---|
| Closed | Larson Christopher J | $0 | |
| Open | Larson Christopher J | $261,250 | |
| Previous Owner | Wilcox Mildred C | $182,139 | |
| Previous Owner | Jones Donald P | $92,382 |
Source: Public Records
Tax History Compared to Growth
Tax History
| Year | Tax Paid | Tax Assessment Tax Assessment Total Assessment is a certain percentage of the fair market value that is determined by local assessors to be the total taxable value of land and additions on the property. | Land | Improvement |
|---|---|---|---|---|
| 2025 | $4,336 | $432,600 | $218,600 | $214,000 |
| 2024 | $4,336 | $423,900 | $211,100 | $212,800 |
| 2023 | $4,336 | $389,300 | $197,900 | $191,400 |
| 2022 | $4,131 | $431,000 | $198,000 | $233,000 |
| 2021 | $3,719 | $295,700 | $115,000 | $180,700 |
| 2019 | $3,158 | $270,600 | $96,200 | $174,400 |
| 2018 | $3,415 | $242,800 | $80,100 | $162,700 |
| 2017 | $2,995 | $216,100 | $65,400 | $150,700 |
| 2016 | $2,602 | $165,300 | $49,100 | $116,200 |
| 2014 | $2,381 | $149,600 | $43,800 | $105,800 |
| 2013 | $2,381 | $137,200 | $41,200 | $96,000 |
Source: Public Records
Map
Nearby Homes
- 7330 S Wilkeson St Unit 1-4
- 7322 S Alaska St
- 7817 S Asotin St
- 7233 S Sheridan Ave
- 1509 S 81st St
- 1738 S 82nd St
- 8027 S Sheridan Ave
- 8035 S Sheridan Ave
- 1615 S 84th St
- 1611 S 84th St
- 7431 S Fife St
- 7420 S J St
- 1318 S 82nd St
- 6202 S Sheridan Ave
- 1005 S 80th St
- 6635 S Wapato St
- 1632 S 86th St
- 861 S 72nd St
- 7021 S I St
- 807 S 74th St
- 1711 S 76th St
- 7361 S Wilkeson St
- 7368 S Alaska St
- 7374 S Alaska St
- 7362 S Alaska St
- 7368 S Wilkeson St Unit A-D
- 7368 S Wilkeson St Unit C
- 7368 S Wilkeson St Unit D
- 7368 S Wilkeson St Unit A
- 7368 S Wilkeson St Unit B
- 7368 S Wilkeson St
- 7368 S Wilkeson St
- 7374 S Wilkeson St Unit D
- 7374 S Wilkeson St
- 7374 S Wilkeson St Unit B
- 7374 S Wilkeson St Unit C
- 7374 S Wilkeson St
- 1712 S 76th St
- 7356 S Alaska St
- 7362 S Wilkeson St