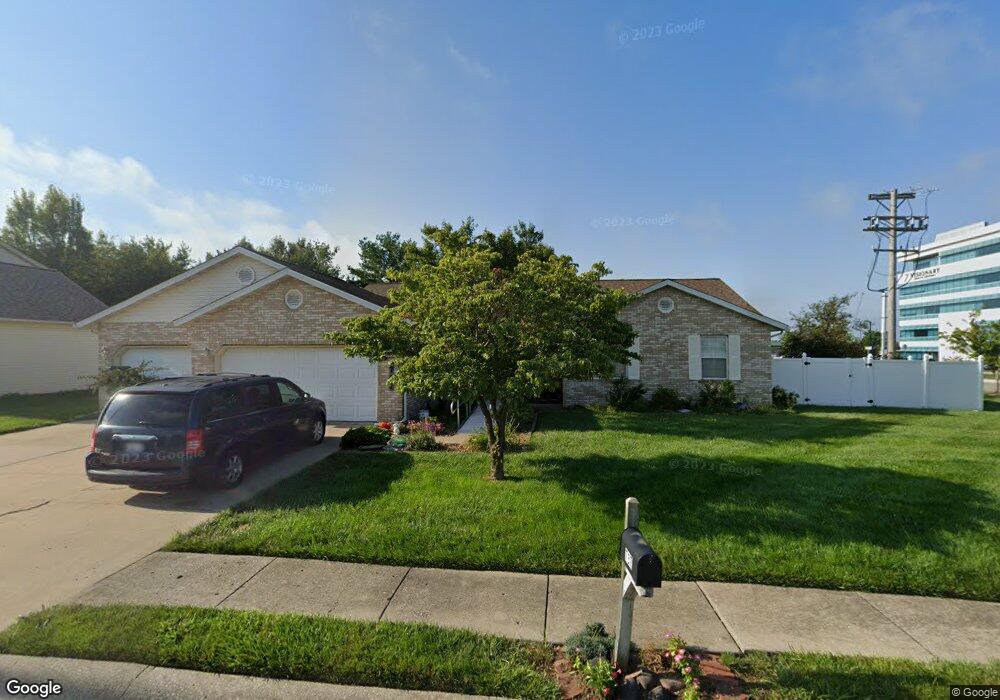
737 Aladar Dr O Fallon, IL 62269
Estimated Value: $316,000 - $339,000
Studio
--
Bath
1,830
Sq Ft
$180/Sq Ft
Est. Value
About This Home
This home is located at 737 Aladar Dr, O Fallon, IL 62269 and is currently estimated at $329,156, approximately $179 per square foot. 737 Aladar Dr is a home located in St. Clair County with nearby schools including Evans Elementary School, Carriel Junior High School, and O'Fallon Township High School.
Ownership History
Date
Name
Owned For
Owner Type
Purchase Details
Closed on
Jul 23, 2014
Sold by
Levine Marc C and Levine Nancy K
Bought by
Levine Family Trust and Levine N Karen
Current Estimated Value
Purchase Details
Closed on
Feb 10, 2006
Sold by
Va
Bought by
Levine Marc C and Levine Nancy K
Home Financials for this Owner
Home Financials are based on the most recent Mortgage that was taken out on this home.
Original Mortgage
$140,080
Outstanding Balance
$53,464
Interest Rate
1%
Mortgage Type
Fannie Mae Freddie Mac
Estimated Equity
$275,692
Purchase Details
Closed on
Aug 26, 2005
Sold by
Ratliff Emerson
Bought by
Va
Purchase Details
Closed on
Aug 11, 2005
Sold by
Aspen West Financial Services
Bought by
Ratliff Emerson and Ratliff Gwen
Purchase Details
Closed on
Jun 27, 2005
Sold by
Ratliff Emerson and Ratliff Gwen
Bought by
Aspen West Financial Services
Create a Home Valuation Report for This Property
The Home Valuation Report is an in-depth analysis detailing your home's value as well as a comparison with similar homes in the area
Home Values in the Area
Average Home Value in this Area
Purchase History
| Date | Buyer | Sale Price | Title Company |
|---|---|---|---|
| Levine Family Trust | -- | None Available | |
| Levine Marc C | -- | First County Title Company | |
| Va | -- | -- | |
| Ratliff Emerson | -- | -- | |
| Aspen West Financial Services | -- | -- |
Source: Public Records
Mortgage History
| Date | Status | Borrower | Loan Amount |
|---|---|---|---|
| Open | Levine Marc C | $140,080 |
Source: Public Records
Tax History
| Year | Tax Paid | Tax Assessment Tax Assessment Total Assessment is a certain percentage of the fair market value that is determined by local assessors to be the total taxable value of land and additions on the property. | Land | Improvement |
|---|---|---|---|---|
| 2024 | $5,962 | $92,610 | $15,066 | $77,544 |
| 2023 | $5,407 | $82,196 | $13,372 | $68,824 |
| 2022 | $5,045 | $75,569 | $12,294 | $63,275 |
| 2021 | $5,158 | $75,811 | $12,333 | $63,478 |
| 2020 | $5,105 | $71,762 | $11,675 | $60,087 |
| 2019 | $4,965 | $71,762 | $11,675 | $60,087 |
| 2018 | $4,812 | $69,679 | $11,336 | $58,343 |
| 2017 | $4,591 | $58,333 | $12,572 | $45,761 |
| 2016 | $5,129 | $63,936 | $12,279 | $51,657 |
| 2014 | $4,655 | $63,197 | $12,137 | $51,060 |
| 2013 | $4,535 | $64,425 | $12,134 | $52,291 |
Source: Public Records
Map
Nearby Homes
- 521 Jeffrey Pine Ct
- 764 Granite Dr
- 926 - 932 Georgetowne Dr
- 747 Michael St Unit 66
- 411 Donna Dr
- 519 Joy Dr
- 756 Erika St Unit 49
- 643 Rain Hollow Dr
- 321 Amy Dr
- 317 Aladar Dr
- 205 Main St
- 262 Eagle Ridge
- 195 Eagle Ridge Unit 195
- 215 Eagle Ridge Unit 215
- 244 Eagle Ridge
- 415 Ponderosa Ave Unit 6
- 166 Eagle Ridge Unit 166
- 164 Eagle Ridge
- 161 Eagle Ridge Unit 161
- 302 Eagle Ridge
- 731 Aladar Dr
- 736 Aladar Dr
- 725 Aladar Dr
- 730 Aladar Dr
- 724 Aladar Dr
- 719 Aladar Dr
- 733 Winfield Dr
- 718 Aladar Dr
- 739 Winfield Dr
- 713 Aladar Dr
- 1405 N Green Mount Rd Unit 260
- 727 Winfield Dr
- 496 Regency Park
- 712 Aladar Dr
- 721 Winfield Dr
- 707 Aladar Dr
- 738 Winfield Dr
- 706 Aladar Dr
- 715 Winfield Dr
- 732 Winfield Dr
Your Personal Tour Guide
Ask me questions while you tour the home.