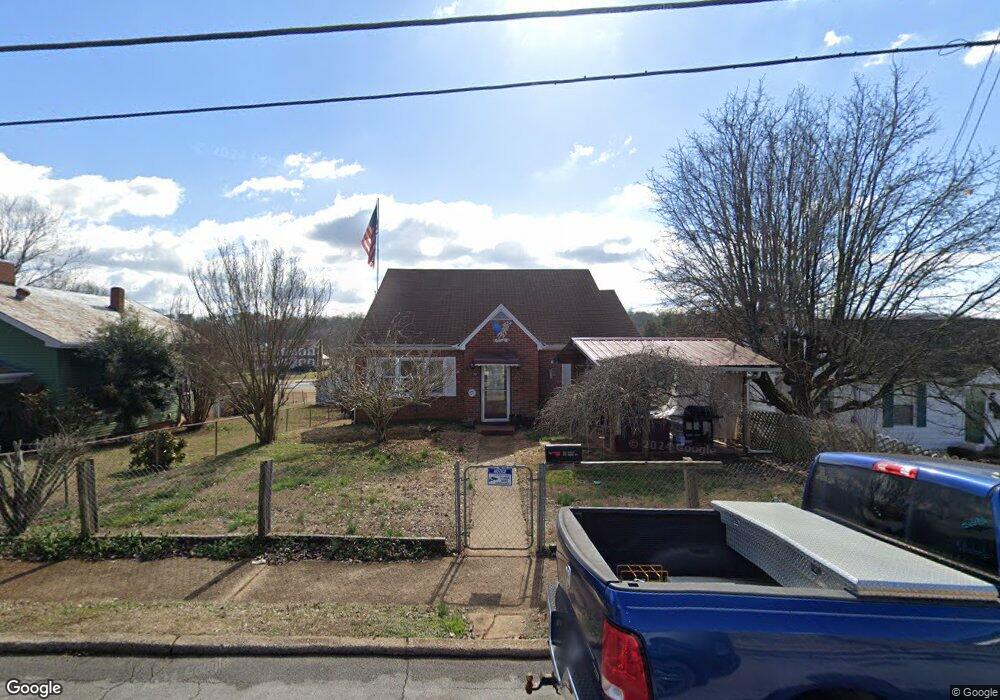
737 Ferry St Loudon, TN 37774
Estimated Value: $191,806 - $260,000
Studio
2
Baths
2,502
Sq Ft
$92/Sq Ft
Est. Value
About This Home
This home is located at 737 Ferry St, Loudon, TN 37774 and is currently estimated at $228,952, approximately $91 per square foot. 737 Ferry St is a home located in Loudon County with nearby schools including Loudon High School.
Ownership History
Date
Name
Owned For
Owner Type
Purchase Details
Closed on
May 14, 2025
Sold by
Cole Danny
Bought by
Cole Danny and Cole Michele Len
Current Estimated Value
Home Financials for this Owner
Home Financials are based on the most recent Mortgage that was taken out on this home.
Original Mortgage
$96,662
Outstanding Balance
$95,302
Interest Rate
5.82%
Mortgage Type
New Conventional
Estimated Equity
$133,650
Purchase Details
Closed on
Apr 30, 2002
Sold by
John Marrs
Bought by
Danny Cole
Home Financials for this Owner
Home Financials are based on the most recent Mortgage that was taken out on this home.
Original Mortgage
$74,411
Interest Rate
7.12%
Purchase Details
Closed on
Dec 30, 1993
Sold by
Marrs Ed A
Bought by
Marrs John B
Create a Home Valuation Report for This Property
The Home Valuation Report is an in-depth analysis detailing your home's value as well as a comparison with similar homes in the area
Home Values in the Area
Average Home Value in this Area
Purchase History
| Date | Buyer | Sale Price | Title Company |
|---|---|---|---|
| Cole Danny | -- | None Listed On Document | |
| Cole Danny | -- | None Listed On Document | |
| Danny Cole | $75,000 | -- | |
| Marrs John B | $31,081 | -- |
Source: Public Records
Mortgage History
| Date | Status | Borrower | Loan Amount |
|---|---|---|---|
| Open | Cole Danny | $96,662 | |
| Closed | Cole Danny | $96,662 | |
| Previous Owner | Marrs John B | $74,411 |
Source: Public Records
Tax History
| Year | Tax Paid | Tax Assessment Tax Assessment Total Assessment is a certain percentage of the fair market value that is determined by local assessors to be the total taxable value of land and additions on the property. | Land | Improvement |
|---|---|---|---|---|
| 2025 | $575 | $32,500 | $3,900 | $28,600 |
| 2024 | $850 | $32,500 | $3,900 | $28,600 |
| 2023 | $850 | $32,500 | $0 | $0 |
| 2022 | $850 | $32,500 | $3,900 | $28,600 |
| 2021 | $850 | $32,500 | $3,900 | $28,600 |
| 2020 | $658 | $32,500 | $3,900 | $28,600 |
| 2019 | $658 | $21,650 | $2,750 | $18,900 |
| 2018 | $645 | $21,650 | $2,750 | $18,900 |
| 2017 | $645 | $21,650 | $2,750 | $18,900 |
| 2016 | $660 | $21,750 | $3,375 | $18,375 |
| 2015 | $656 | $21,600 | $3,375 | $18,225 |
| 2014 | $656 | $21,600 | $3,375 | $18,225 |
Source: Public Records
Map
Nearby Homes
Your Personal Tour Guide
Ask me questions while you tour the home.