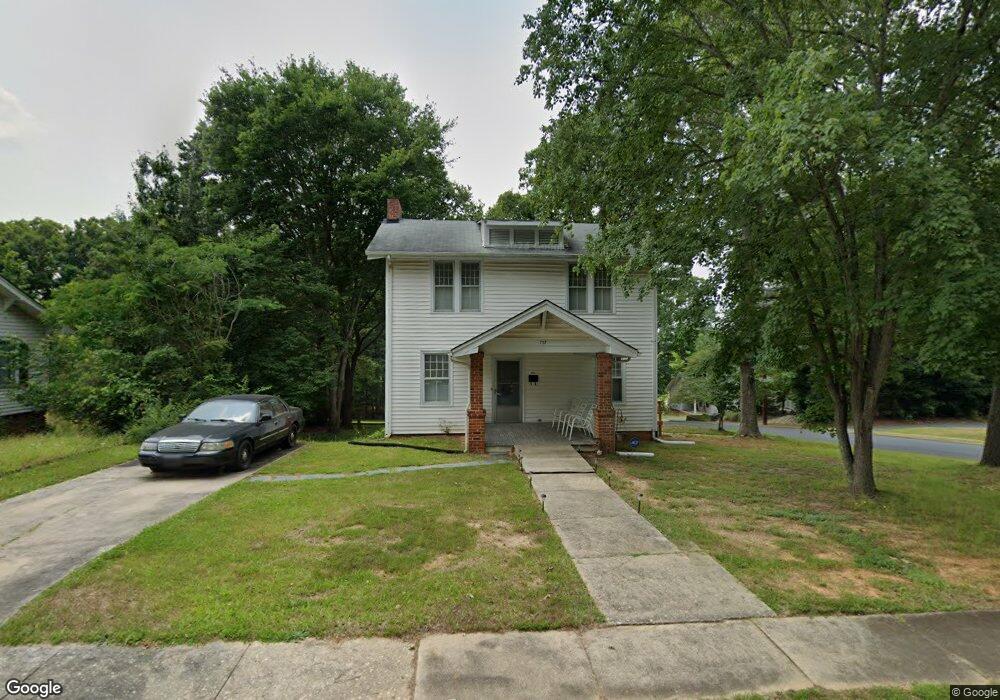
737 N 3rd St Unit 17 Albemarle, NC 28001
Estimated Value: $136,000 - $189,430
5
Beds
1
Bath
810
Sq Ft
$208/Sq Ft
Est. Value
About This Home
This home is located at 737 N 3rd St Unit 17, Albemarle, NC 28001 and is currently estimated at $168,143, approximately $207 per square foot. 737 N 3rd St Unit 17 is a home located in Stanly County with nearby schools including Central Elementary School, Albemarle Middle School, and Albemarle High School.
Ownership History
Date
Name
Owned For
Owner Type
Purchase Details
Closed on
Jul 15, 2021
Sold by
Cvf Iii Mortgage Loan Trust
Bought by
Arce Roberto and Arce Awilda
Current Estimated Value
Purchase Details
Closed on
Oct 25, 2018
Sold by
Daymark Trustee Llc
Bought by
Cvf Iii Mortgage Loan Trust Ii and Delaware Statutory Trust
Purchase Details
Closed on
Sep 23, 2016
Sold by
Daymark Trustee Llc
Bought by
Smith John and Smith Libby
Home Financials for this Owner
Home Financials are based on the most recent Mortgage that was taken out on this home.
Original Mortgage
$76,973
Interest Rate
3.43%
Mortgage Type
Seller Take Back
Purchase Details
Closed on
Jul 28, 2015
Sold by
Cranford Martha O
Bought by
Daymark Trustee Llc and Daymark Master Trust
Purchase Details
Closed on
Sep 3, 2012
Bought by
Harris Thelma M Heirs
Create a Home Valuation Report for This Property
The Home Valuation Report is an in-depth analysis detailing your home's value as well as a comparison with similar homes in the area
Purchase History
| Date | Buyer | Sale Price | Title Company |
|---|---|---|---|
| Arce Roberto | $80,000 | None Listed On Document | |
| Cvf Iii Mortgage Loan Trust Ii | $32,167,045 | Crown Title Corp | |
| Smith John | $78,000 | Servicelink | |
| Daymark Trustee Llc | $30,000 | Attorney | |
| Harris Thelma M Heirs | -- | -- |
Source: Public Records
Mortgage History
| Date | Status | Borrower | Loan Amount |
|---|---|---|---|
| Previous Owner | Smith John | $76,973 |
Source: Public Records
Tax History
| Year | Tax Paid | Tax Assessment Tax Assessment Total Assessment is a certain percentage of the fair market value that is determined by local assessors to be the total taxable value of land and additions on the property. | Land | Improvement |
|---|---|---|---|---|
| 2025 | $1,066 | $95,190 | $12,152 | $83,038 |
| 2024 | $860 | $70,523 | $6,730 | $63,793 |
| 2023 | $860 | $70,523 | $6,730 | $63,793 |
| 2022 | $860 | $70,523 | $6,730 | $63,793 |
| 2021 | $860 | $70,523 | $6,730 | $63,793 |
| 2020 | $646 | $49,783 | $5,982 | $43,801 |
| 2019 | $652 | $49,783 | $5,982 | $43,801 |
| 2018 | $652 | $49,783 | $5,982 | $43,801 |
| 2017 | $627 | $49,783 | $5,982 | $43,801 |
| 2016 | $597 | $47,377 | $5,982 | $41,395 |
| 2015 | $603 | $47,377 | $5,982 | $41,395 |
| 2014 | $281 | $47,377 | $5,982 | $41,395 |
Source: Public Records
Map
Nearby Homes
- 203 E Cannon Ave
- 507 N 5th St
- 219 Troy Alexander Dr
- 436 E Oakwood Ave
- 346 N Depot St
- 274 N 4th St
- 218 Wilson St Unit A&B
- 701 E Oakwood Ave
- 620 N 9th St Unit 5/6
- 719 Avondale Ave
- 711 Yadkin St
- 10.02 Ash St
- 729 Montgomery Ave
- 815 Sherwood Ave
- 610 Watts St
- 526 Graham St
- 511 W Oakwood Ave
- 622 Watts St
- 1026 N 10th St
- 714 Wiscassett St
Your Personal Tour Guide
Ask me questions while you tour the home.