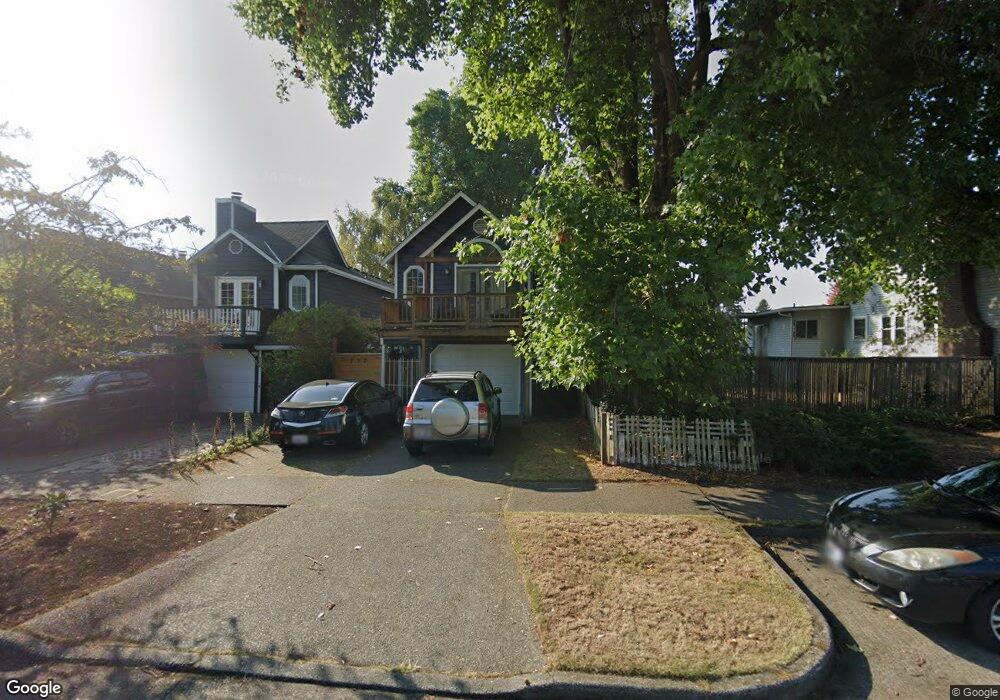
737 N 87th St Seattle, WA 98103
Greenwood NeighborhoodEstimated Value: $778,915 - $877,000
3
Beds
2
Baths
760
Sq Ft
$1,082/Sq Ft
Est. Value
About This Home
This home is located at 737 N 87th St, Seattle, WA 98103 and is currently estimated at $821,979, approximately $1,081 per square foot. 737 N 87th St is a home located in King County with nearby schools including Daniel Bagley Elementary School, Robert Eagle Staff Middle School, and Ingraham High School.
Ownership History
Date
Name
Owned For
Owner Type
Purchase Details
Closed on
Jan 23, 2017
Sold by
Bermudez Marietta C
Bought by
Bermudez Marcelino G
Current Estimated Value
Purchase Details
Closed on
Sep 26, 1997
Sold by
Walker Kathy A
Bought by
Bermudez Marc G and Bermudez Marietta E
Home Financials for this Owner
Home Financials are based on the most recent Mortgage that was taken out on this home.
Original Mortgage
$136,000
Outstanding Balance
$22,023
Interest Rate
7.54%
Estimated Equity
$799,956
Purchase Details
Closed on
Aug 25, 1996
Sold by
Graham Bradley K
Bought by
Walker Kathy A
Home Financials for this Owner
Home Financials are based on the most recent Mortgage that was taken out on this home.
Original Mortgage
$108,500
Interest Rate
8.23%
Purchase Details
Closed on
Dec 20, 1993
Sold by
Graham Cecil J and Graham Catherine E
Bought by
Graham Bradley K
Home Financials for this Owner
Home Financials are based on the most recent Mortgage that was taken out on this home.
Original Mortgage
$125,600
Interest Rate
7.09%
Create a Home Valuation Report for This Property
The Home Valuation Report is an in-depth analysis detailing your home's value as well as a comparison with similar homes in the area
Home Values in the Area
Average Home Value in this Area
Purchase History
| Date | Buyer | Sale Price | Title Company |
|---|---|---|---|
| Bermudez Marcelino G | -- | None Available | |
| Bermudez Marc G | $171,500 | Chicago Title Ins Co | |
| Walker Kathy A | $155,000 | Chicago Title Insurance Co | |
| Graham Bradley K | -- | Evergreen Title Company Inc |
Source: Public Records
Mortgage History
| Date | Status | Borrower | Loan Amount |
|---|---|---|---|
| Open | Bermudez Marc G | $136,000 | |
| Previous Owner | Walker Kathy A | $108,500 | |
| Previous Owner | Graham Bradley K | $125,600 |
Source: Public Records
Tax History Compared to Growth
Tax History
| Year | Tax Paid | Tax Assessment Tax Assessment Total Assessment is a certain percentage of the fair market value that is determined by local assessors to be the total taxable value of land and additions on the property. | Land | Improvement |
|---|---|---|---|---|
| 2024 | $6,580 | $665,000 | $318,000 | $347,000 |
| 2023 | $6,047 | $624,000 | $353,000 | $271,000 |
| 2022 | $5,688 | $684,000 | $316,000 | $368,000 |
| 2021 | $5,077 | $604,000 | $288,000 | $316,000 |
| 2020 | $5,087 | $509,000 | $240,000 | $269,000 |
| 2018 | $4,757 | $534,000 | $231,000 | $303,000 |
| 2017 | $3,897 | $469,000 | $187,000 | $282,000 |
| 2016 | $3,625 | $395,000 | $158,000 | $237,000 |
| 2015 | $3,142 | $359,000 | $144,000 | $215,000 |
| 2014 | -- | $316,000 | $129,000 | $187,000 |
| 2013 | -- | $288,000 | $118,000 | $170,000 |
Source: Public Records
Map
Nearby Homes
- 719 N 85th St
- 937 N 87th St Unit A
- 939 N 87th St Unit A
- 921 N 85th St
- 8547 Evanston Ave N
- 8710 Dayton Ave N
- 9005 Fremont Ave N Unit A
- 516 N 83rd St
- 8849 Nesbit Ave N
- 8523 Midvale Ave N Unit A
- 8553 Midvale Ave N Unit C
- 8829 Midvale Ave N
- 1126 N 90th St
- 320 N 84th St
- 9221 Linden Ave N Unit C
- 9221 Linden Ave N Unit A
- 318 B N 84th St
- 1128 N 91st St
- 1150 N 90th St
- 8750 Greenwood Ave N Unit S207