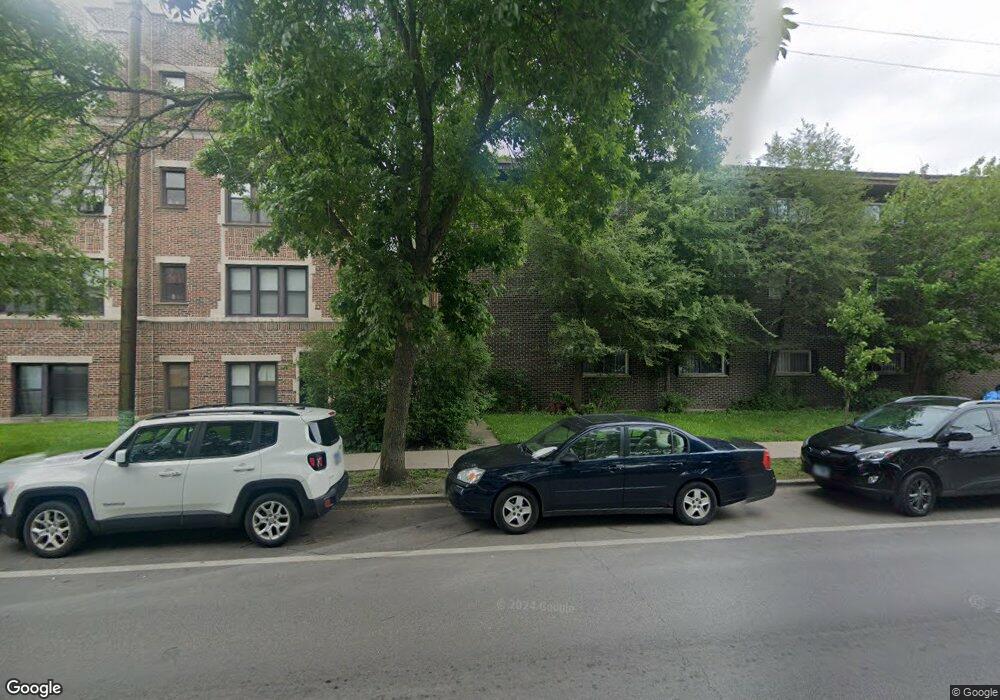
737 N Central Ave Unit 204 Chicago, IL 60644
Austin NeighborhoodEstimated Value: $65,029 - $190,000
--
Bed
--
Bath
--
Sq Ft
0.48
Acres
About This Home
This home is located at 737 N Central Ave Unit 204, Chicago, IL 60644 and is currently estimated at $121,257. 737 N Central Ave Unit 204 is a home located in Cook County with nearby schools including The Field School and St Paul Lutheran School.
Ownership History
Date
Name
Owned For
Owner Type
Purchase Details
Closed on
Jan 15, 2015
Sold by
Z Financial Illinois G Properties Llc
Bought by
Gmmc Corporation
Current Estimated Value
Home Financials for this Owner
Home Financials are based on the most recent Mortgage that was taken out on this home.
Original Mortgage
$24,373
Outstanding Balance
$18,669
Interest Rate
3.84%
Mortgage Type
Seller Take Back
Estimated Equity
$102,588
Purchase Details
Closed on
Mar 8, 2001
Sold by
Peter M Jacobsohn Co
Bought by
Davis Leon Z
Home Financials for this Owner
Home Financials are based on the most recent Mortgage that was taken out on this home.
Original Mortgage
$67,500
Interest Rate
9.87%
Purchase Details
Closed on
Dec 12, 1994
Sold by
Kuykendall Raymone
Bought by
The Peter M Jacobsohn Co
Purchase Details
Closed on
Oct 4, 1994
Sold by
Northwest Austin Council
Bought by
Kuykendall Raymone
Create a Home Valuation Report for This Property
The Home Valuation Report is an in-depth analysis detailing your home's value as well as a comparison with similar homes in the area
Home Values in the Area
Average Home Value in this Area
Purchase History
| Date | Buyer | Sale Price | Title Company |
|---|---|---|---|
| Gmmc Corporation | $32,500 | None Available | |
| Davis Leon Z | $75,000 | Chicago Title Insurance Co | |
| The Peter M Jacobsohn Co | $9,000 | -- | |
| Kuykendall Raymone | -- | -- |
Source: Public Records
Mortgage History
| Date | Status | Borrower | Loan Amount |
|---|---|---|---|
| Open | Gmmc Corporation | $24,373 | |
| Previous Owner | Davis Leon Z | $67,500 |
Source: Public Records
Tax History Compared to Growth
Tax History
| Year | Tax Paid | Tax Assessment Tax Assessment Total Assessment is a certain percentage of the fair market value that is determined by local assessors to be the total taxable value of land and additions on the property. | Land | Improvement |
|---|---|---|---|---|
| 2024 | $507 | $6,762 | $1,140 | $5,622 |
| 2023 | $494 | $2,405 | $807 | $1,598 |
| 2022 | $494 | $2,405 | $807 | $1,598 |
| 2021 | $483 | $2,404 | $807 | $1,597 |
| 2020 | $651 | $2,923 | $807 | $2,116 |
| 2019 | $653 | $3,249 | $807 | $2,442 |
| 2018 | $642 | $3,249 | $807 | $2,442 |
| 2017 | $626 | $2,910 | $712 | $2,198 |
| 2016 | $583 | $2,910 | $712 | $2,198 |
| 2015 | $533 | $2,910 | $712 | $2,198 |
| 2014 | $581 | $3,133 | $736 | $2,397 |
| 2013 | $570 | $3,133 | $736 | $2,397 |
Source: Public Records
Map
Nearby Homes
- 5523 W Huron St
- 836 N Parkside Ave
- 655 N Lotus Ave
- 600 N Pine Ave
- 744 N Long Ave
- 5616 W Ohio St
- 556 N Central Ave
- 5348 W Chicago Ave
- 645 N Long Ave
- 840 N Massasoit Ave
- 5731 W Ohio St
- 701 N Lorel Ave
- 5415 W Augusta Blvd
- 5636 W Augusta Blvd
- 5460 W Ferdinand St
- 822 N Lockwood Ave
- 5320 W Ohio St
- 5256 W Chicago Ave
- 821 N Lockwood Ave
- 5516 W Cortez St
- 737 N Central Ave Unit 102
- 737 N Central Ave Unit 201
- 737 N Central Ave Unit 101
- 737 N Central Ave Unit 208
- 737 N Central Ave Unit 103
- 737 N Central Ave Unit 308
- 737 N Central Ave Unit 305
- 737 N Central Ave Unit 207
- 737 N Central Ave Unit 205
- 737 N Central Ave Unit 304
- 737 N Central Ave Unit 206
- 737 N Central Ave Unit 108
- 737 N Central Ave Unit 203
- 737 N Central Ave Unit 303
- 737 N Central Ave Unit 306
- 737 N Central Ave Unit 107
- 737 N Central Ave Unit 307
- 737 N Central Ave Unit 105
- 737 N Central Ave Unit 302
- 737 N Central Ave Unit 301