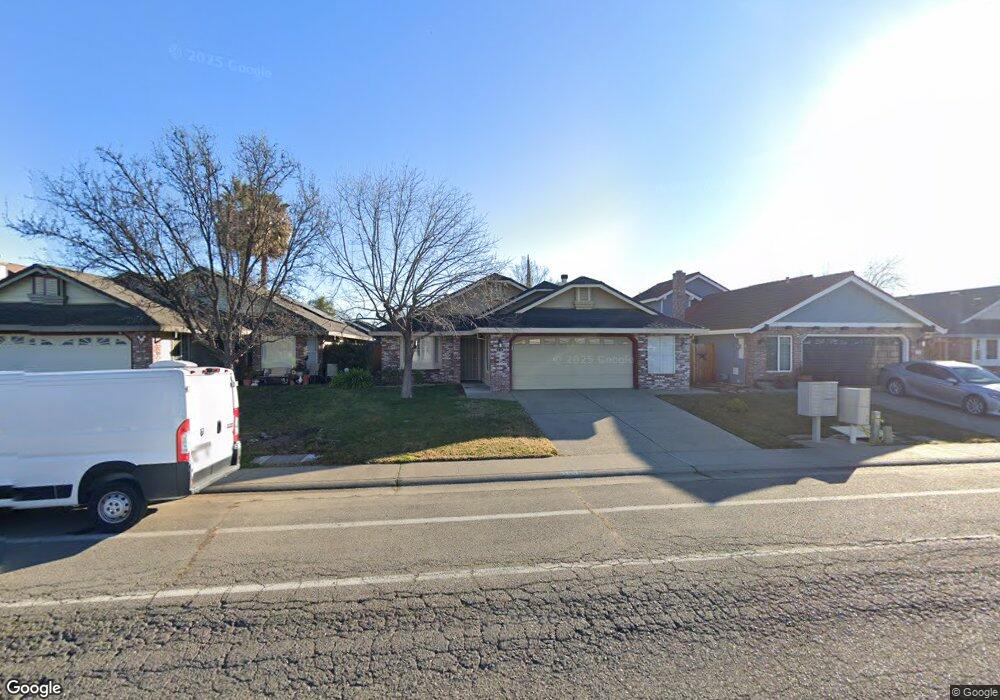
737 N O St Lincoln, CA 95648
Estimated Value: $468,000 - $507,000
3
Beds
2
Baths
1,429
Sq Ft
$344/Sq Ft
Est. Value
About This Home
This home is located at 737 N O St, Lincoln, CA 95648 and is currently estimated at $491,144, approximately $343 per square foot. 737 N O St is a home located in Placer County with nearby schools including First Street, Glen Edwards Middle, and Lincoln High.
Ownership History
Date
Name
Owned For
Owner Type
Purchase Details
Closed on
Aug 15, 2021
Sold by
Brown Rebekah L
Bought by
Shook James
Current Estimated Value
Purchase Details
Closed on
Jul 23, 2018
Sold by
Cisneros Gloria and Stalians Laura Alarcon
Bought by
Brown Rebekah L
Home Financials for this Owner
Home Financials are based on the most recent Mortgage that was taken out on this home.
Original Mortgage
$348,570
Interest Rate
4.6%
Mortgage Type
FHA
Purchase Details
Closed on
Mar 30, 2004
Sold by
Alarcon Alex A
Bought by
Alarcon Alex A
Create a Home Valuation Report for This Property
The Home Valuation Report is an in-depth analysis detailing your home's value as well as a comparison with similar homes in the area
Home Values in the Area
Average Home Value in this Area
Purchase History
| Date | Buyer | Sale Price | Title Company |
|---|---|---|---|
| Shook James | $515,500 | Placer Title Company | |
| Brown Rebekah L | $355,000 | Orange Coast Title Co | |
| Alarcon Alex A | -- | -- |
Source: Public Records
Mortgage History
| Date | Status | Borrower | Loan Amount |
|---|---|---|---|
| Previous Owner | Brown Rebekah L | $348,570 |
Source: Public Records
Tax History Compared to Growth
Tax History
| Year | Tax Paid | Tax Assessment Tax Assessment Total Assessment is a certain percentage of the fair market value that is determined by local assessors to be the total taxable value of land and additions on the property. | Land | Improvement |
|---|---|---|---|---|
| 2025 | $1,152 | $100,488 | $17,160 | $83,328 |
| 2023 | $1,152 | $96,589 | $16,495 | $80,094 |
| 2022 | $1,122 | $94,696 | $16,172 | $78,524 |
| 2021 | $4,004 | $365,850 | $82,445 | $283,405 |
| 2020 | $3,961 | $360,000 | $81,100 | $278,900 |
| 2019 | $3,882 | $355,000 | $80,000 | $275,000 |
| 2018 | $2,326 | $209,627 | $77,693 | $131,934 |
| 2017 | $2,182 | $205,518 | $76,170 | $129,348 |
| 2016 | $2,130 | $201,489 | $74,677 | $126,812 |
| 2015 | $2,084 | $198,464 | $73,556 | $124,908 |
| 2014 | $2,031 | $194,578 | $72,116 | $122,462 |
Source: Public Records
Map
Nearby Homes