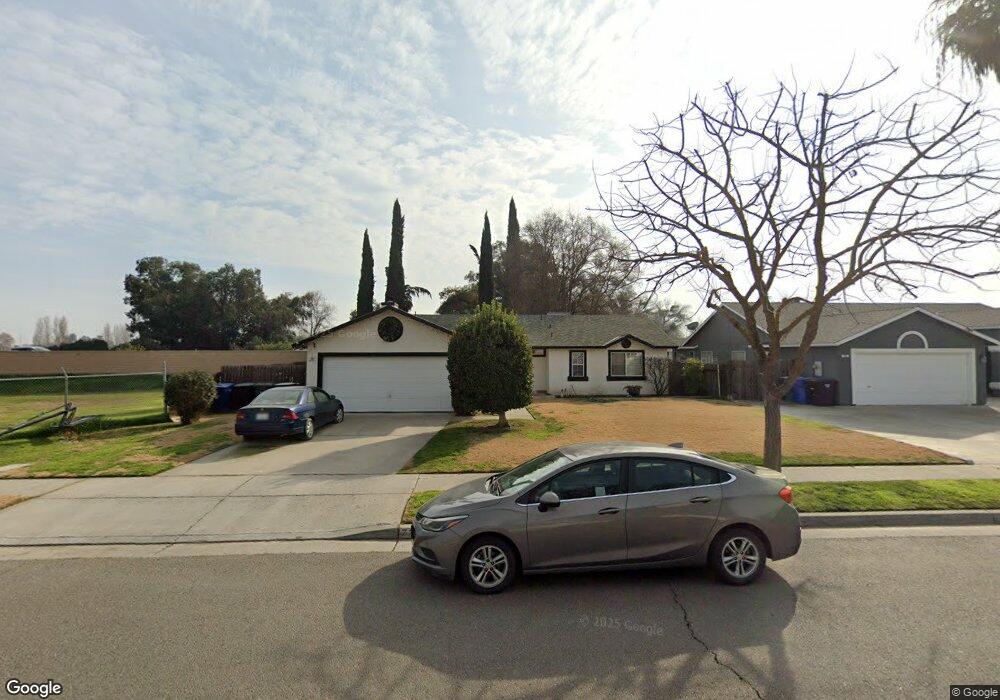
737 Naples St Lemoore, CA 93245
Estimated Value: $297,000 - $318,000
3
Beds
2
Baths
1,114
Sq Ft
$275/Sq Ft
Est. Value
About This Home
This home is located at 737 Naples St, Lemoore, CA 93245 and is currently estimated at $306,369, approximately $275 per square foot. 737 Naples St is a home located in Kings County with nearby schools including Lemoore Elementary School, Liberty Middle School, and Lemoore High School.
Ownership History
Date
Name
Owned For
Owner Type
Purchase Details
Closed on
Nov 30, 2011
Sold by
Hayward Investment Company Inc
Bought by
Weas Properties Inc
Current Estimated Value
Purchase Details
Closed on
Mar 22, 2011
Sold by
Banner Investments Llc
Bought by
Hayward Investments Company Inc
Purchase Details
Closed on
Nov 23, 2010
Sold by
Arch Bay Holdings Llc
Bought by
Banner Investments Llc
Purchase Details
Closed on
Jun 15, 2010
Sold by
Gallegos Steve D
Bought by
Arch Bay Holdings Llc 2009C
Purchase Details
Closed on
Dec 9, 2002
Sold by
Machado Manuel C and Machado Kim D
Bought by
Gallegos Steve D
Home Financials for this Owner
Home Financials are based on the most recent Mortgage that was taken out on this home.
Original Mortgage
$115,000
Interest Rate
6.15%
Mortgage Type
VA
Create a Home Valuation Report for This Property
The Home Valuation Report is an in-depth analysis detailing your home's value as well as a comparison with similar homes in the area
Home Values in the Area
Average Home Value in this Area
Purchase History
| Date | Buyer | Sale Price | Title Company |
|---|---|---|---|
| Weas Properties Inc | -- | None Available | |
| Hayward Investments Company Inc | $137,500 | Chicago Title Company | |
| Banner Investments Llc | -- | Lawyers Title | |
| Arch Bay Holdings Llc 2009C | $104,900 | None Available | |
| Gallegos Steve D | $115,000 | Chicago Title Company |
Source: Public Records
Mortgage History
| Date | Status | Borrower | Loan Amount |
|---|---|---|---|
| Previous Owner | Gallegos Steve D | $115,000 |
Source: Public Records
Tax History
| Year | Tax Paid | Tax Assessment Tax Assessment Total Assessment is a certain percentage of the fair market value that is determined by local assessors to be the total taxable value of land and additions on the property. | Land | Improvement |
|---|---|---|---|---|
| 2025 | $1,803 | $176,158 | $64,058 | $112,100 |
| 2023 | $1,803 | $169,319 | $61,571 | $107,748 |
| 2022 | $1,891 | $166,000 | $60,364 | $105,636 |
| 2021 | $1,844 | $162,746 | $59,181 | $103,565 |
| 2020 | $1,834 | $161,077 | $58,574 | $102,503 |
| 2019 | $1,820 | $157,918 | $57,425 | $100,493 |
| 2018 | $1,711 | $154,822 | $56,299 | $98,523 |
| 2017 | $1,715 | $151,786 | $55,195 | $96,591 |
| 2016 | $1,614 | $148,810 | $54,113 | $94,697 |
| 2015 | $1,607 | $146,575 | $53,300 | $93,275 |
| 2014 | $1,561 | $143,704 | $52,256 | $91,448 |
Source: Public Records
Map
Nearby Homes
- 738 Naples St
- 750 Naples St
- 726 Naples St
- 713 Naples St
- 762 Naples St
- 436 Barcelona Dr
- 433 Riviera Dr
- 701 Naples St
- 785 Naples St
- 459 Barcelona Dr
- 447 Barcelona Dr
- 422 Barcelona Dr
- 419 Riviera Dr
- 464 Riviera Dr
- 435 Barcelona Dr
- 408 Barcelona Dr
- 448 Riviera Dr
- 405 Riviera Dr
- 432 Riviera Dr
- 391 Riviera Dr
Your Personal Tour Guide
Ask me questions while you tour the home.