Estimated Value: $241,109 - $279,000
3
Beds
2
Baths
1,530
Sq Ft
$173/Sq Ft
Est. Value
About This Home
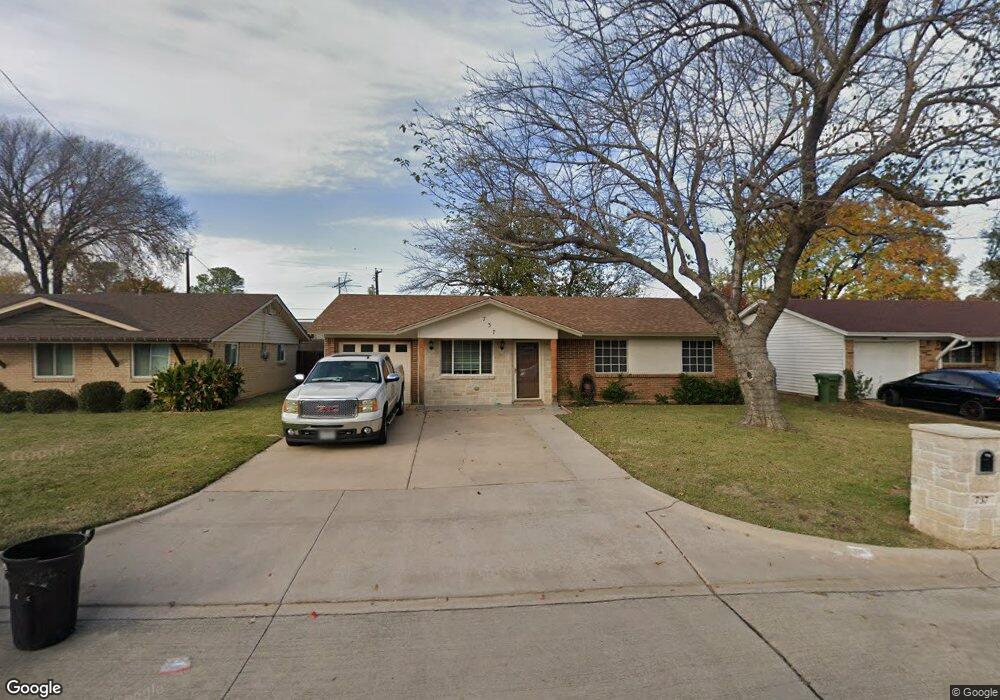
This home is located at 737 Tanglewood Dr, Hurst, TX 76053 and is currently estimated at $264,777, approximately $173 per square foot. 737 Tanglewood Dr is a home located in Tarrant County with nearby schools including Bellaire Elementary School, Hurst J High School, and L.D. Bell High School.
Ownership History
Date
Name
Owned For
Owner Type
Purchase Details
Closed on
Jan 23, 2015
Sold by
The Estate Of Camela Faye Crececy
Bought by
Beltran Dimas R
Current Estimated Value
Home Financials for this Owner
Home Financials are based on the most recent Mortgage that was taken out on this home.
Original Mortgage
$116,844
Outstanding Balance
$92,404
Interest Rate
4.75%
Mortgage Type
FHA
Estimated Equity
$172,373
Purchase Details
Closed on
Nov 11, 2014
Sold by
Creecy Ronald Scott
Bought by
Creecy Ronald Ray
Purchase Details
Closed on
Nov 10, 2014
Sold by
Creecy Cody James
Bought by
Creecy Ronald Ray
Purchase Details
Closed on
Oct 10, 1997
Sold by
Creecy James W and Creecy Martha A
Bought by
Creecy Ronald Ray and Creecy Camela Faye
Create a Home Valuation Report for This Property
The Home Valuation Report is an in-depth analysis detailing your home's value as well as a comparison with similar homes in the area
Home Values in the Area
Average Home Value in this Area
Purchase History
| Date | Buyer | Sale Price | Title Company |
|---|---|---|---|
| Beltran Dimas R | -- | None Available | |
| Creecy Ronald Ray | -- | None Available | |
| Creecy Ronald Ray | -- | None Available | |
| Creecy Ronald Ray | -- | -- |
Source: Public Records
Mortgage History
| Date | Status | Borrower | Loan Amount |
|---|---|---|---|
| Open | Beltran Dimas R | $116,844 | |
| Closed | Creecy Ronald Ray | $0 |
Source: Public Records
Tax History Compared to Growth
Tax History
| Year | Tax Paid | Tax Assessment Tax Assessment Total Assessment is a certain percentage of the fair market value that is determined by local assessors to be the total taxable value of land and additions on the property. | Land | Improvement |
|---|---|---|---|---|
| 2025 | $2,985 | $218,958 | $35,000 | $183,958 |
| 2024 | $2,985 | $218,958 | $35,000 | $183,958 |
| 2023 | $3,945 | $220,601 | $35,000 | $185,601 |
| 2022 | $4,122 | $214,223 | $35,000 | $179,223 |
| 2021 | $3,925 | $166,356 | $35,000 | $131,356 |
| 2020 | $3,560 | $156,076 | $35,000 | $121,076 |
| 2019 | $3,292 | $164,362 | $35,000 | $129,362 |
| 2018 | $2,469 | $122,281 | $19,000 | $103,281 |
| 2017 | $2,939 | $116,138 | $19,000 | $97,138 |
| 2016 | $3,038 | $120,073 | $19,000 | $101,073 |
| 2015 | $1,303 | $63,100 | $15,000 | $48,100 |
| 2014 | $1,303 | $63,100 | $15,000 | $48,100 |
Source: Public Records
Map
Nearby Homes
- 720 Tanglewood Dr
- 704 Tanglewood Dr
- 716 E Pecan St Unit 716 - 722
- 1302 Woodridge Cir
- 712 Brookfield Dr
- 1407 Woodridge Cir
- 1501 Woodridge Cir
- 1200 Tanglewood Trail
- 1309 Driftwood Dr
- 832 Chateau Valee Cir
- 508 Oak Park Dr
- 803 Glenda Dr
- 802 Brown Trail
- 849 Russell Ln
- 212 E Ellen Ave
- 644 Caduceus Ln
- 812 Forest Hollow Dr
- 552 Norwood Dr
- 120 Donald Dr
- 933 Wade Dr
- 741 Tanglewood Dr
- 733 Tanglewood Dr
- 745 Tanglewood Dr
- 729 Tanglewood Dr
- 748 E Pecan St
- 740 E Pecan St
- 736 Tanglewood Dr
- 725 Tanglewood Dr
- 749 Tanglewood Dr
- 756 E Pecan St
- 732 Tanglewood Dr
- 750 E Pecan St
- 740 Tanglewood Dr
- 760 E Pecan St
- 738 E Pecan St
- 758 E Pecan St
- 728 Tanglewood Dr
- 744 Tanglewood Dr
- 732 E Pecan St
- 732 E Pecan St Unit 736