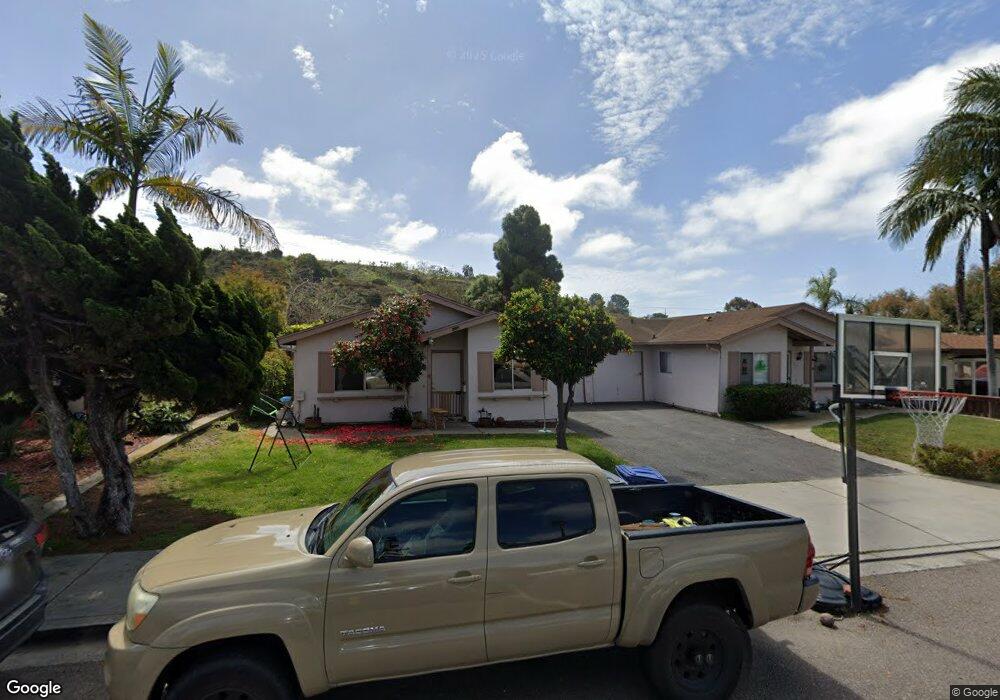
737 Teaberry St Encinitas, CA 92024
Central Encinitas NeighborhoodEstimated Value: $785,441 - $1,159,000
2
Beds
1
Bath
827
Sq Ft
$1,213/Sq Ft
Est. Value
About This Home
This home is located at 737 Teaberry St, Encinitas, CA 92024 and is currently estimated at $1,003,110, approximately $1,212 per square foot. 737 Teaberry St is a home located in San Diego County with nearby schools including Park Dale Lane Elementary, Oak Crest Middle School, and La Costa Canyon High School.
Ownership History
Date
Name
Owned For
Owner Type
Purchase Details
Closed on
Nov 29, 2012
Sold by
Tompkins Paul S and Tompkins Gail L
Bought by
Tompkins Paul S and Tompkins Gail L
Current Estimated Value
Home Financials for this Owner
Home Financials are based on the most recent Mortgage that was taken out on this home.
Original Mortgage
$158,000
Outstanding Balance
$109,417
Interest Rate
3.36%
Mortgage Type
New Conventional
Estimated Equity
$893,693
Purchase Details
Closed on
Jan 12, 1996
Sold by
Tompkins Paul S and Tompkins Gail L
Bought by
Tompkins Paul S and Tompkins Gail L
Home Financials for this Owner
Home Financials are based on the most recent Mortgage that was taken out on this home.
Original Mortgage
$70,000
Interest Rate
7.18%
Purchase Details
Closed on
Nov 14, 1995
Sold by
Hinman Rouse and Hall Sue
Bought by
Tompkins Paul S and Tompkins Gail L
Home Financials for this Owner
Home Financials are based on the most recent Mortgage that was taken out on this home.
Original Mortgage
$70,000
Interest Rate
7.18%
Create a Home Valuation Report for This Property
The Home Valuation Report is an in-depth analysis detailing your home's value as well as a comparison with similar homes in the area
Home Values in the Area
Average Home Value in this Area
Purchase History
| Date | Buyer | Sale Price | Title Company |
|---|---|---|---|
| Tompkins Paul S | -- | Fidelity National Title Co | |
| Tompkins Paul S | -- | Fidelity National Title Co | |
| Tompkins Paul S | -- | -- | |
| Tompkins Paul S | $100,000 | Southland Title Corporation |
Source: Public Records
Mortgage History
| Date | Status | Borrower | Loan Amount |
|---|---|---|---|
| Open | Tompkins Paul S | $158,000 | |
| Previous Owner | Tompkins Paul S | $70,000 |
Source: Public Records
Tax History
| Year | Tax Paid | Tax Assessment Tax Assessment Total Assessment is a certain percentage of the fair market value that is determined by local assessors to be the total taxable value of land and additions on the property. | Land | Improvement |
|---|---|---|---|---|
| 2025 | $2,136 | $164,430 | $92,497 | $71,933 |
| 2024 | $2,136 | $161,207 | $90,684 | $70,523 |
| 2023 | $2,081 | $158,047 | $88,906 | $69,141 |
| 2022 | $1,942 | $154,949 | $87,163 | $67,786 |
| 2021 | $2,050 | $151,911 | $85,454 | $66,457 |
| 2020 | $2,093 | $150,354 | $84,578 | $65,776 |
| 2019 | $2,059 | $147,407 | $82,920 | $64,487 |
| 2018 | $2,030 | $144,518 | $81,295 | $63,223 |
| 2017 | $1,996 | $141,685 | $79,701 | $61,984 |
| 2016 | $1,927 | $138,908 | $78,139 | $60,769 |
| 2015 | $1,877 | $136,823 | $76,966 | $59,857 |
| 2014 | $1,817 | $134,144 | $75,459 | $58,685 |
Source: Public Records
Map
Nearby Homes
- 800 Encinitas Blvd Unit 104
- 731 Teaberry St Unit 4
- 155 Rosebay Dr Unit 42
- 935 Encinitas Blvd
- 548 Quail Pointe Ln
- 271 Coneflower St
- 664 Sea Ridge Ct
- 760 Bonita Dr
- 598 Paloma Ct
- 634 Shasta Dr
- 407 Requeza St Unit E9
- 103 Mangano Cir
- 1010 Scarlet Way
- 1009 Arcadia Rd
- 623 Quail Gardens Ln
- 350 N El Camino Real Unit 78s
- 350 N El Camino Real Unit 72
- 444 N El Camino Real Unit 47
- 444 N El Camino Real Unit 48
- 444 N El Camino Real Unit SPC 42
- 739 Teaberry St
- 743 Teaberry St
- 745 Teaberry St
- 733 Teaberry St
- 736 Teaberry St
- 738 Teaberry St
- 749 Teaberry St
- 751 Teaberry St
- 742 Teaberry St
- 744 Teaberry St
- 820 Encinitas Blvd
- 760 Encinitas Blvd
- 800 Encinitas Blvd Unit 204
- 800 Encinitas Blvd Unit 103
- 800 Encinitas Blvd Unit 203
- 800 Encinitas Blvd Unit 105
- 760 Encinitas Blvd Unit 104
- 820 Encinitas Blvd Unit 205
- 820 Encinitas Blvd Unit 202
- 820 Encinitas Blvd Unit 201
Your Personal Tour Guide
Ask me questions while you tour the home.