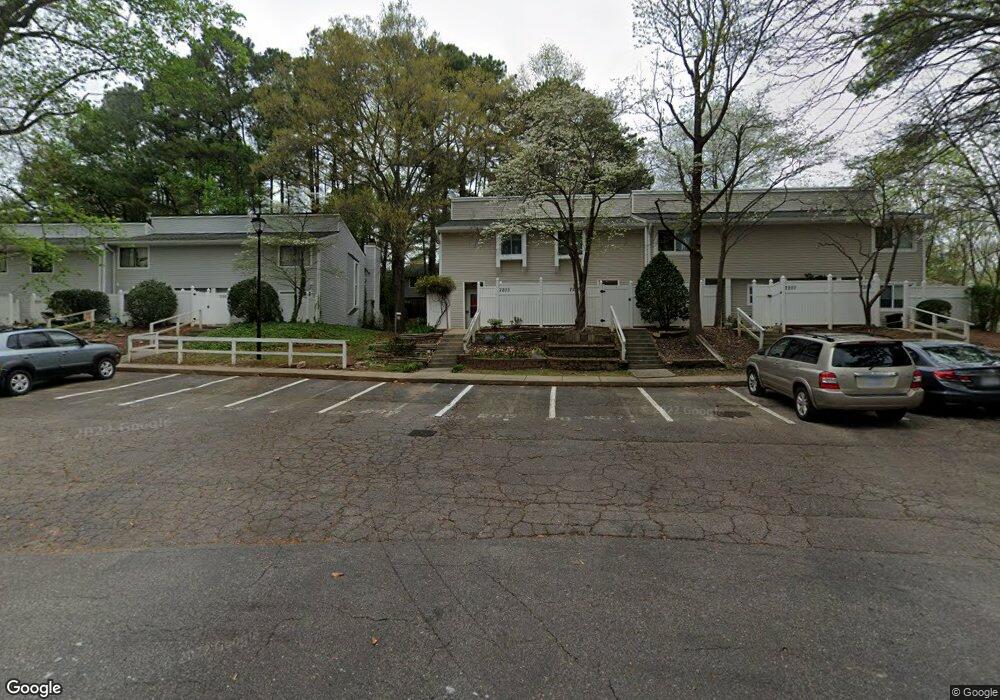
7373 Sandy Creek Dr Unit U3 Raleigh, NC 27615
Six Forks NeighborhoodEstimated Value: $221,000 - $251,000
3
Beds
3
Baths
1,400
Sq Ft
$169/Sq Ft
Est. Value
About This Home
This home is located at 7373 Sandy Creek Dr Unit U3, Raleigh, NC 27615 and is currently estimated at $237,024, approximately $169 per square foot. 7373 Sandy Creek Dr Unit U3 is a home located in Wake County with nearby schools including Pleasant Union Elementary School, West Millbrook Middle School, and Sanderson High School.
Ownership History
Date
Name
Owned For
Owner Type
Purchase Details
Closed on
Apr 29, 2005
Sold by
Barlow Anthony Q and Pickney Tanessa
Bought by
Barlow Anthony Q
Current Estimated Value
Home Financials for this Owner
Home Financials are based on the most recent Mortgage that was taken out on this home.
Original Mortgage
$105,315
Outstanding Balance
$54,134
Interest Rate
5.62%
Mortgage Type
New Conventional
Estimated Equity
$182,890
Purchase Details
Closed on
Apr 30, 2003
Sold by
Paschall James H and Sicoli Russell
Bought by
Barlow Anthony Q
Home Financials for this Owner
Home Financials are based on the most recent Mortgage that was taken out on this home.
Original Mortgage
$80,000
Interest Rate
6.65%
Purchase Details
Closed on
Mar 24, 2000
Sold by
Papenhausen Peter R and Papenhausen Monika
Bought by
Paschall James H
Home Financials for this Owner
Home Financials are based on the most recent Mortgage that was taken out on this home.
Original Mortgage
$90,700
Interest Rate
8.37%
Mortgage Type
FHA
Create a Home Valuation Report for This Property
The Home Valuation Report is an in-depth analysis detailing your home's value as well as a comparison with similar homes in the area
Home Values in the Area
Average Home Value in this Area
Purchase History
| Date | Buyer | Sale Price | Title Company |
|---|---|---|---|
| Barlow Anthony Q | -- | -- | |
| Barlow Anthony Q | $100,000 | -- | |
| Paschall James H | $93,000 | -- |
Source: Public Records
Mortgage History
| Date | Status | Borrower | Loan Amount |
|---|---|---|---|
| Open | Barlow Anthony Q | $105,315 | |
| Closed | Barlow Anthony Q | $80,000 | |
| Previous Owner | Paschall James H | $90,700 | |
| Closed | Barlow Anthony Q | $20,000 |
Source: Public Records
Tax History Compared to Growth
Tax History
| Year | Tax Paid | Tax Assessment Tax Assessment Total Assessment is a certain percentage of the fair market value that is determined by local assessors to be the total taxable value of land and additions on the property. | Land | Improvement |
|---|---|---|---|---|
| 2025 | $2,213 | $251,497 | -- | $251,497 |
| 2024 | $2,204 | $251,497 | $0 | $251,497 |
| 2023 | $1,597 | $144,711 | $0 | $144,711 |
| 2022 | $1,398 | $144,711 | $0 | $144,711 |
| 2021 | $1,428 | $144,711 | $0 | $144,711 |
| 2020 | $1,402 | $144,711 | $0 | $144,711 |
| 2019 | $1,193 | $101,186 | $0 | $101,186 |
| 2018 | $1,126 | $101,186 | $0 | $101,186 |
| 2017 | $1,073 | $101,186 | $0 | $101,186 |
| 2016 | $1,051 | $101,186 | $0 | $101,186 |
| 2015 | $1,100 | $104,266 | $0 | $104,266 |
| 2014 | $1,044 | $104,266 | $0 | $104,266 |
Source: Public Records
Map
Nearby Homes
- 7719 Kelley Ct Unit 314E
- 7320 Sandy Creek Dr
- 7729 Bernadette Ln Unit 322B
- 7412 Penny Hill Ln
- 232 Wetherburn Ln
- 204 Bracken Ct
- 800 Plentywood Ct
- 213 Bracken Ct
- 812 Havenwood Ct
- 7715 Kingsberry Ct
- 7731 Kingsberry Ct
- 7329 Bonnie Ridge Ct
- 119 Yorkchester Way
- 7046 Longstreet Dr Unit C
- 136 Yorkchester Way
- 7804 Brandyapple Dr
- 7124 Longstreet Dr
- 7002 Longstreet Dr Unit C
- 7108 Longstreet Dr Unit A
- 7020 Longstreet Dr Unit A
- 7371 Sandy Creek Dr
- 7371 Sandy Creek Dr Unit 4
- 7375 Sandy Creek Dr
- 7375 Sandy Creek Dr Unit 2
- 7375 Sandy Creek Dr
- 7377 Sandy Creek Dr Unit U1
- 7377 Sandy Creek Dr Unit 7377
- 7377 Sandy Creek Dr Unit 1
- 7369 Sandy Creek Dr Unit W7
- 7369 Sandy Creek Dr
- 7369 Sandy Creek Dr
- 7369 Sandy Creek Dr
- 7367 Sandy Creek Dr Unit W6
- 7365 Sandy Creek Dr Unit 7365
- 7363 Sandy Creek Dr
- 7363 Sandy Creek Dr Unit 4
- 7701 Bernadette Ln
- 7389 Sandy Creek Dr
- 7387 Sandy Creek Dr Unit T2
- 7315 Sandy Creek Dr Unit 7