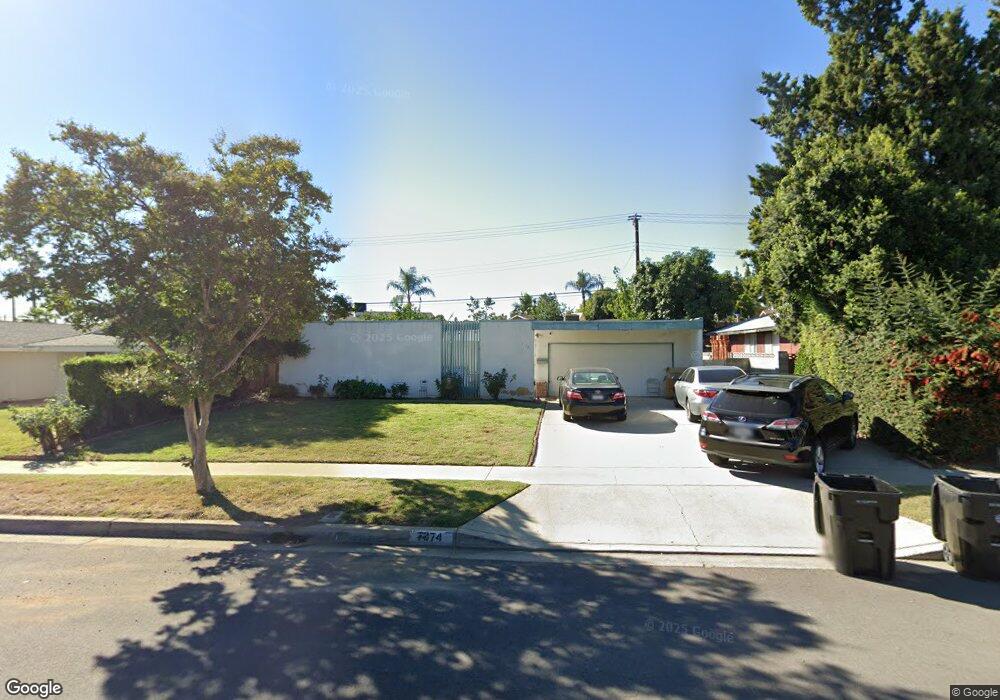
7374 Layton St Rancho Cucamonga, CA 91730
Estimated Value: $652,000 - $758,000
4
Beds
2
Baths
1,471
Sq Ft
$486/Sq Ft
Est. Value
About This Home
This home is located at 7374 Layton St, Rancho Cucamonga, CA 91730 and is currently estimated at $714,430, approximately $485 per square foot. 7374 Layton St is a home located in San Bernardino County with nearby schools including Valle Vista Elementary, Cucamonga Middle, and Alta Loma High.
Ownership History
Date
Name
Owned For
Owner Type
Purchase Details
Closed on
Aug 4, 2025
Sold by
Gway Jeffrey J and Gway Lillian
Bought by
Gway Jeffrey J and Gway Lillian Q
Current Estimated Value
Purchase Details
Closed on
May 15, 2003
Sold by
Vanlam Le Van
Bought by
Gway Jeffrey J and Gway Lillian
Home Financials for this Owner
Home Financials are based on the most recent Mortgage that was taken out on this home.
Original Mortgage
$176,000
Interest Rate
5.53%
Mortgage Type
Purchase Money Mortgage
Purchase Details
Closed on
Jan 25, 2002
Sold by
Treeaporn Pichai
Bought by
Vanlam Le Van
Purchase Details
Closed on
Jan 23, 2002
Sold by
Le Ai Thi
Bought by
Vanlam Le Van
Create a Home Valuation Report for This Property
The Home Valuation Report is an in-depth analysis detailing your home's value as well as a comparison with similar homes in the area
Home Values in the Area
Average Home Value in this Area
Purchase History
| Date | Buyer | Sale Price | Title Company |
|---|---|---|---|
| Gway Jeffrey J | -- | None Listed On Document | |
| Gway Jeffrey J | $220,000 | First American | |
| Vanlam Le Van | -- | Southland Title Corporation | |
| Vanlam Le Van | -- | Southland Title Corporation |
Source: Public Records
Mortgage History
| Date | Status | Borrower | Loan Amount |
|---|---|---|---|
| Previous Owner | Gway Jeffrey J | $176,000 |
Source: Public Records
Tax History Compared to Growth
Tax History
| Year | Tax Paid | Tax Assessment Tax Assessment Total Assessment is a certain percentage of the fair market value that is determined by local assessors to be the total taxable value of land and additions on the property. | Land | Improvement |
|---|---|---|---|---|
| 2025 | $4,102 | $376,572 | $150,630 | $225,942 |
| 2024 | $4,102 | $369,188 | $147,676 | $221,512 |
| 2023 | $4,013 | $361,949 | $144,780 | $217,169 |
| 2022 | $3,949 | $354,852 | $141,941 | $212,911 |
| 2021 | $3,949 | $347,894 | $139,158 | $208,736 |
| 2020 | $3,836 | $344,327 | $137,731 | $206,596 |
| 2019 | $3,818 | $337,575 | $135,030 | $202,545 |
| 2018 | $3,711 | $330,956 | $132,382 | $198,574 |
| 2017 | $3,645 | $324,466 | $129,786 | $194,680 |
| 2016 | $3,602 | $318,104 | $127,241 | $190,863 |
| 2015 | $3,563 | $313,326 | $125,330 | $187,996 |
| 2014 | $3,461 | $307,188 | $122,875 | $184,313 |
Source: Public Records
Map
Nearby Homes
- 7430 Leucite Ave
- 7534 Layton St
- 7315 Klusman Ave
- 7236 Hellman Ave
- 9118 Baseline Rd
- 7087 Hellman Ave
- 7730 Layton St
- 9599 Church St
- 9800 Base Line Rd Unit 79
- 7420 London Ave
- 7795 Malachite Ave
- 9800 Baseline Rd Unit 71
- 9800 Baseline Rd Unit 17
- 9800 Baseline Rd Unit 82
- 9800 Baseline Rd Unit 62
- 8976 Yew St
- 7355 Vineyard Ave
- 9684 Hemlock St
- 9056 La Vine St
- 6946 Archibald Ave