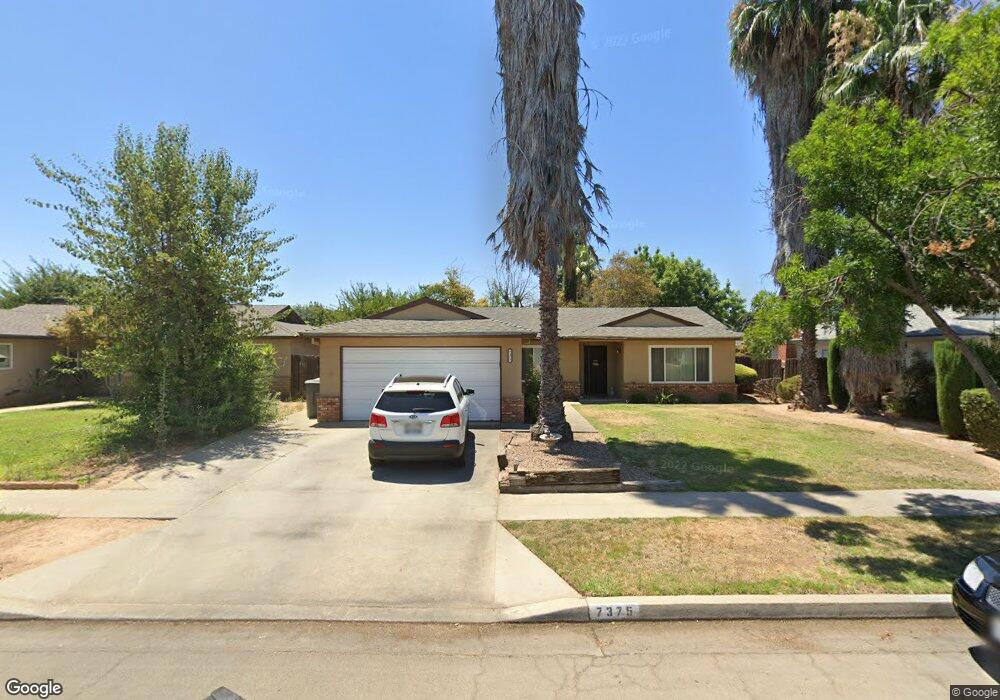
7375 N Thorne Ave Fresno, CA 93711
Bullard NeighborhoodEstimated Value: $377,000 - $389,000
3
Beds
2
Baths
1,434
Sq Ft
$268/Sq Ft
Est. Value
About This Home
This home is located at 7375 N Thorne Ave, Fresno, CA 93711 and is currently estimated at $384,798, approximately $268 per square foot. 7375 N Thorne Ave is a home located in Fresno County with nearby schools including Nelson Elementary School, Kastner Intermediate School, and Clovis West High School.
Ownership History
Date
Name
Owned For
Owner Type
Purchase Details
Closed on
Aug 15, 2007
Sold by
Sanchez Imelda
Bought by
Sanchez Imelda
Current Estimated Value
Purchase Details
Closed on
Jul 15, 2002
Sold by
Negrete Arthur Rene and Negrete Jenny
Bought by
Sanchez Robert
Home Financials for this Owner
Home Financials are based on the most recent Mortgage that was taken out on this home.
Original Mortgage
$132,102
Outstanding Balance
$55,245
Interest Rate
6.52%
Mortgage Type
FHA
Estimated Equity
$329,553
Purchase Details
Closed on
Oct 4, 1995
Sold by
Lopes Norman V and Lopes Steven
Bought by
Negrete Arthur Rene and Negrete Jenny
Home Financials for this Owner
Home Financials are based on the most recent Mortgage that was taken out on this home.
Original Mortgage
$86,592
Interest Rate
7.58%
Mortgage Type
FHA
Create a Home Valuation Report for This Property
The Home Valuation Report is an in-depth analysis detailing your home's value as well as a comparison with similar homes in the area
Home Values in the Area
Average Home Value in this Area
Purchase History
| Date | Buyer | Sale Price | Title Company |
|---|---|---|---|
| Sanchez Imelda | -- | None Available | |
| Sanchez Robert | $134,000 | Fidelity National Title Co | |
| Negrete Arthur Rene | $87,000 | Chicago Title Co | |
| Lopes Norman | -- | Chicago Title Co | |
| Lopes Steven | -- | Chicago Title Co |
Source: Public Records
Mortgage History
| Date | Status | Borrower | Loan Amount |
|---|---|---|---|
| Open | Sanchez Robert | $132,102 | |
| Previous Owner | Negrete Arthur Rene | $86,592 | |
| Closed | Sanchez Robert | $8,040 |
Source: Public Records
Tax History Compared to Growth
Tax History
| Year | Tax Paid | Tax Assessment Tax Assessment Total Assessment is a certain percentage of the fair market value that is determined by local assessors to be the total taxable value of land and additions on the property. | Land | Improvement |
|---|---|---|---|---|
| 2025 | $2,925 | $194,054 | $44,886 | $149,168 |
| 2023 | $2,747 | $186,521 | $43,144 | $143,377 |
| 2022 | $2,594 | $182,865 | $42,299 | $140,566 |
| 2021 | $2,532 | $179,280 | $41,470 | $137,810 |
| 2020 | $2,513 | $177,442 | $41,045 | $136,397 |
| 2019 | $2,481 | $173,964 | $40,241 | $133,723 |
| 2018 | $2,435 | $170,553 | $39,452 | $131,101 |
| 2017 | $2,400 | $167,210 | $38,679 | $128,531 |
| 2016 | $2,331 | $163,932 | $37,921 | $126,011 |
| 2015 | $2,101 | $161,471 | $37,352 | $124,119 |
| 2014 | $1,916 | $158,309 | $36,621 | $121,688 |
Source: Public Records
Map
Nearby Homes
- 1067 W Minarets Ave
- 1110 W Bedford Ave
- 7166 N Fruit Ave Unit 160
- 7166 N Fruit Ave Unit 132
- 7166 N Fruit Ave Unit 133
- 7178 N Fruit Ave Unit 108
- 7166 N Fruit Ave Unit 127
- 7355 N Pacific Ave
- 7334 N Teilman Ave
- 6737 N Harrison Ave
- 7258 N Channing Way
- 0 0 Unit 633401
- 0 0 Unit 631266
- 1 Palm Ave
- 7047 N Teilman Ave Unit 101
- 7047 N Teilman Ave Unit 102
- 6658 N Thorne Ave
- 6753 N Durant Ave
- 744 W Magill Ave
- 6594 N Farris Ave
- 7367 N Thorne Ave
- 7383 N Thorne Ave
- 7360 N Adoline Ave
- 7346 N Adoline Ave
- 7361 N Thorne Ave
- 7391 N Thorne Ave
- 7368 N Adoline Ave
- 7338 N Adoline Ave
- 7378 N Thorne Ave
- 7370 N Thorne Ave
- 7357 N Thorne Ave
- 7386 N Thorne Ave
- 7399 N Thorne Ave
- 7362 N Thorne Ave
- 7376 N Adoline Ave
- 7330 N Adoline Ave
- 7394 N Thorne Ave
- 7358 N Thorne Ave
- 7345 N Thorne Ave
- 7407 N Thorne Ave