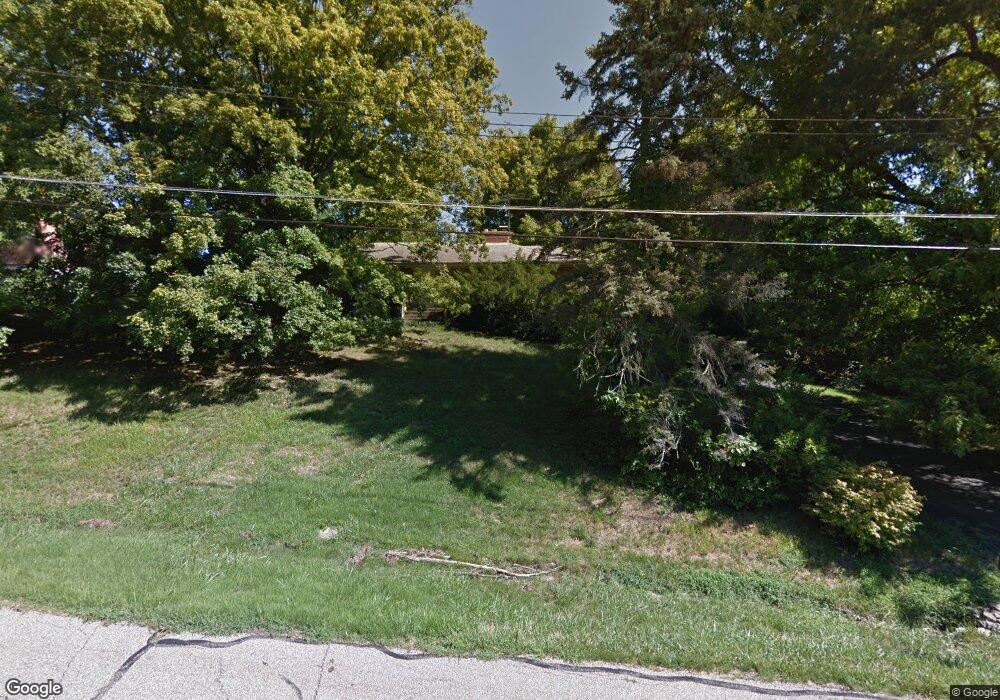
7377 Commonweatlh Dr Springfield Twp., OH 45224
Finneytown NeighborhoodEstimated Value: $324,404 - $360,000
3
Beds
3
Baths
1,596
Sq Ft
$211/Sq Ft
Est. Value
About This Home
This home is located at 7377 Commonweatlh Dr, Springfield Twp., OH 45224 and is currently estimated at $337,101, approximately $211 per square foot. 7377 Commonweatlh Dr is a home located in Hamilton County with nearby schools including Finneytown Elementary School, Finneytown Secondary Campus, and St. Vivian School.
Ownership History
Date
Name
Owned For
Owner Type
Purchase Details
Closed on
Jan 12, 2018
Sold by
Marucci Michael S and Marucucci Tina M
Bought by
Sackenheim Richard Ryan
Current Estimated Value
Home Financials for this Owner
Home Financials are based on the most recent Mortgage that was taken out on this home.
Original Mortgage
$185,250
Outstanding Balance
$156,528
Interest Rate
3.99%
Mortgage Type
Future Advance Clause Open End Mortgage
Estimated Equity
$180,573
Purchase Details
Closed on
Jul 8, 2016
Sold by
Schmaltz Stephen W and Schmaltz Doris
Bought by
Marcucci Michael S and Marcucci Tina M
Purchase Details
Closed on
Aug 2, 1999
Sold by
Schmaltz Stephen W
Bought by
Schmaltz Timothy J
Purchase Details
Closed on
Jul 15, 1999
Sold by
Estate Of Marian E Schmaltz
Bought by
Schmaltz Stephen W and Schmaltz Timothy J
Create a Home Valuation Report for This Property
The Home Valuation Report is an in-depth analysis detailing your home's value as well as a comparison with similar homes in the area
Home Values in the Area
Average Home Value in this Area
Purchase History
| Date | Buyer | Sale Price | Title Company |
|---|---|---|---|
| Sackenheim Richard Ryan | $195,000 | None Available | |
| Marcucci Michael S | $82,000 | 360 American Title | |
| Schmaltz Timothy J | $62,500 | -- | |
| Schmaltz Stephen W | -- | -- |
Source: Public Records
Mortgage History
| Date | Status | Borrower | Loan Amount |
|---|---|---|---|
| Open | Sackenheim Richard Ryan | $185,250 |
Source: Public Records
Tax History Compared to Growth
Tax History
| Year | Tax Paid | Tax Assessment Tax Assessment Total Assessment is a certain percentage of the fair market value that is determined by local assessors to be the total taxable value of land and additions on the property. | Land | Improvement |
|---|---|---|---|---|
| 2024 | $6,809 | $94,707 | $13,773 | $80,934 |
| 2023 | $6,580 | $94,707 | $13,773 | $80,934 |
| 2022 | $6,524 | $68,250 | $13,510 | $54,740 |
| 2021 | $6,535 | $68,250 | $13,510 | $54,740 |
| 2020 | $6,472 | $68,250 | $13,510 | $54,740 |
| 2019 | $2,977 | $28,701 | $11,449 | $17,252 |
| 2018 | $2,755 | $28,701 | $11,449 | $17,252 |
| 2017 | $2,666 | $28,701 | $11,449 | $17,252 |
| 2016 | $2,987 | $42,473 | $12,940 | $29,533 |
| 2015 | $3,019 | $42,473 | $12,940 | $29,533 |
| 2014 | $3,022 | $42,473 | $12,940 | $29,533 |
| 2013 | $3,119 | $44,709 | $13,622 | $31,087 |
Source: Public Records
Map
Nearby Homes
- 517 Wellesley Ave
- 401 W Galbraith Rd
- 429 W Galbraith Rd
- 7423 View Place Dr
- 557 W North Bend Rd
- 162 Ridgeway Rd
- 682 W North Bend Rd
- 216 Hilltop Ln
- 7784 Fancycab Ct
- 685 Bridle Path
- 840 Southmeadow Cir
- 869 Southmeadow Cir Unit 40203
- 801 Southmeadow Cir
- 810 Southmeadow Cir
- 715 Castlegate Ln
- 7865 Ramble View
- 204 Brocdorf Dr
- 8608 Long Ln
- 163 Compton Rd
- 654 Doepke Ln
- 7377 Commonwealth Dr
- 7383 Commonwealth Dr
- 7369 Commonwealth Dr
- 457 Beechtree Dr
- 459 Beechtree Dr
- 7378 Commonwealth Dr
- 7374 Commonwealth Dr
- 455 Beechtree Dr
- 7382 Commonwealth Dr
- 461 Beechtree Dr
- 7363 Commonwealth Dr
- 7391 Commonwealth Dr
- 453 Beechtree Dr
- 7368 Commonwealth Dr
- 451 Beechtree Dr
- 7397 Commonwealth Dr
- 7357 Commonwealth Dr
- 7360 Commonwealth Dr
- 411 Beechtree Dr
- 449 Beechtree Dr