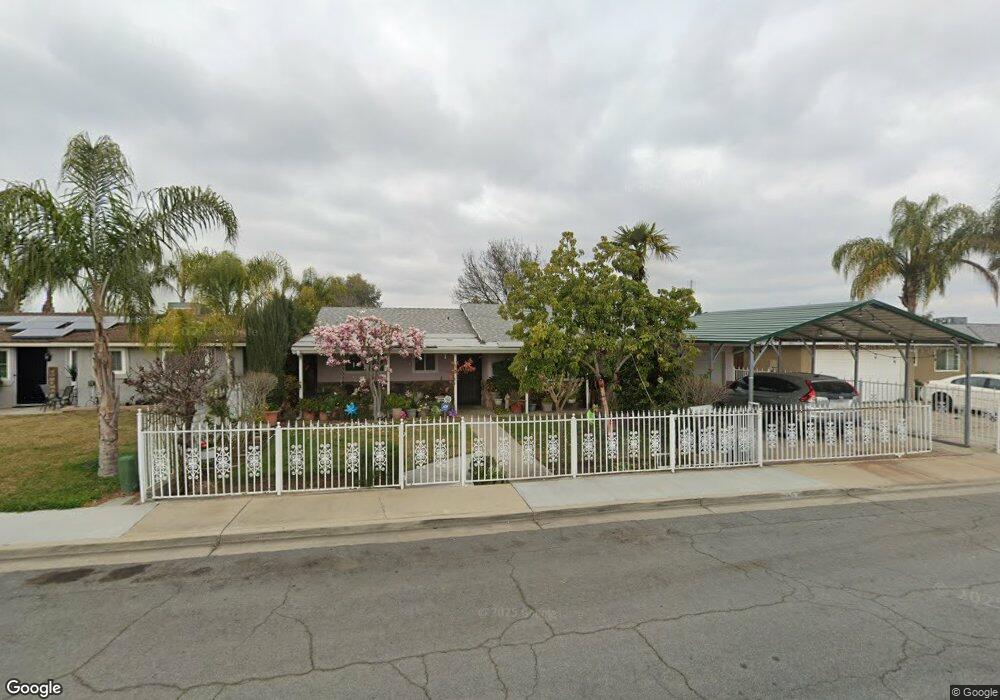
738 11th St Sanger, CA 93657
Estimated Value: $277,424 - $290,000
3
Beds
2
Baths
1,110
Sq Ft
$255/Sq Ft
Est. Value
About This Home
This home is located at 738 11th St, Sanger, CA 93657 and is currently estimated at $283,141, approximately $255 per square foot. 738 11th St is a home located in Fresno County with nearby schools including Jefferson Elementary School, Washington Academic Middle School, and Sanger High School.
Ownership History
Date
Name
Owned For
Owner Type
Purchase Details
Closed on
Apr 20, 2007
Sold by
Salinas Rebecca A
Bought by
Salinas Rebecca A and Rebecca A Salinas Revocable Living Trust
Current Estimated Value
Purchase Details
Closed on
May 5, 2004
Sold by
Gutierrez Esther A and Gutierrez Juan S
Bought by
Lomeli Martha A and Moreno Maria A Hernandez
Purchase Details
Closed on
Nov 6, 2003
Sold by
Gutierrez Esther A and Gutierrez Juan S
Bought by
Lomeli Martha
Purchase Details
Closed on
Feb 2, 2000
Sold by
Alvarez Chavez Esther and Alvarez Esther A
Bought by
Gutierrez Juan S and Gutierrez Esther A
Home Financials for this Owner
Home Financials are based on the most recent Mortgage that was taken out on this home.
Original Mortgage
$28,400
Interest Rate
8.16%
Create a Home Valuation Report for This Property
The Home Valuation Report is an in-depth analysis detailing your home's value as well as a comparison with similar homes in the area
Home Values in the Area
Average Home Value in this Area
Purchase History
| Date | Buyer | Sale Price | Title Company |
|---|---|---|---|
| Salinas Rebecca A | -- | None Available | |
| Lomeli Martha A | -- | -- | |
| Gutierrez Juan S | -- | -- | |
| Lomeli Martha | -- | -- | |
| Gutierrez Juan S | -- | Fidelity National Title |
Source: Public Records
Mortgage History
| Date | Status | Borrower | Loan Amount |
|---|---|---|---|
| Previous Owner | Gutierrez Juan S | $28,400 |
Source: Public Records
Tax History
| Year | Tax Paid | Tax Assessment Tax Assessment Total Assessment is a certain percentage of the fair market value that is determined by local assessors to be the total taxable value of land and additions on the property. | Land | Improvement |
|---|---|---|---|---|
| 2025 | $918 | $77,669 | $19,574 | $58,095 |
| 2023 | $857 | $74,655 | $18,815 | $55,840 |
| 2022 | $843 | $73,193 | $18,447 | $54,746 |
| 2021 | $835 | $71,759 | $18,086 | $53,673 |
| 2020 | $810 | $71,024 | $17,901 | $53,123 |
| 2019 | $793 | $69,632 | $17,550 | $52,082 |
| 2018 | $759 | $68,267 | $17,206 | $51,061 |
| 2017 | $745 | $66,929 | $16,869 | $50,060 |
| 2016 | $699 | $65,618 | $16,539 | $49,079 |
| 2015 | $704 | $64,633 | $16,291 | $48,342 |
| 2014 | $693 | $63,368 | $15,972 | $47,396 |
Source: Public Records
Map
Nearby Homes
Your Personal Tour Guide
Ask me questions while you tour the home.