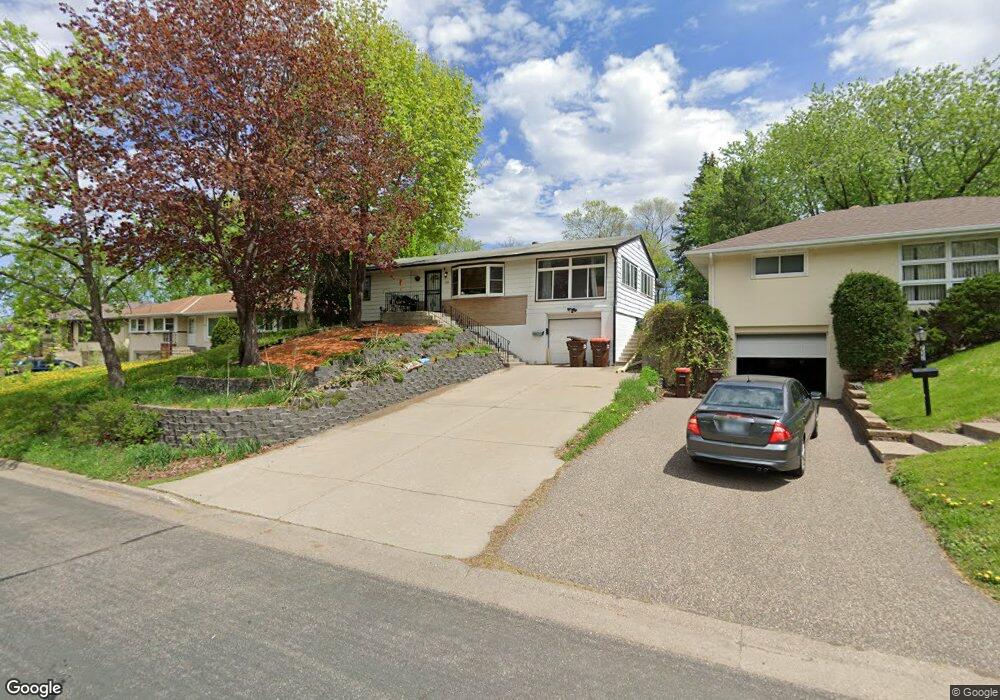
738 738 21st Ave N South St. Paul, MN 55075
Estimated Value: $286,000 - $297,000
2
Beds
1
Bath
1,222
Sq Ft
$239/Sq Ft
Est. Value
About This Home
This home is located at 738 738 21st Ave N, South St. Paul, MN 55075 and is currently estimated at $292,426, approximately $239 per square foot. 738 738 21st Ave N is a home located in Dakota County with nearby schools including Lincoln Center Elementary, South St. Paul Secondary, and Academic Arts High School.
Ownership History
Date
Name
Owned For
Owner Type
Purchase Details
Closed on
Jun 29, 2016
Sold by
Rivas Ana and Rivas Jose Oswaldo
Bought by
Knopik Haley J
Current Estimated Value
Home Financials for this Owner
Home Financials are based on the most recent Mortgage that was taken out on this home.
Original Mortgage
$5,300
Outstanding Balance
$4,242
Interest Rate
3.66%
Mortgage Type
Negative Amortization
Estimated Equity
$288,184
Purchase Details
Closed on
Oct 10, 2014
Sold by
Federal National Mortgage Association
Bought by
Rivas Ana
Home Financials for this Owner
Home Financials are based on the most recent Mortgage that was taken out on this home.
Original Mortgage
$123,226
Interest Rate
4.4%
Mortgage Type
FHA
Purchase Details
Closed on
Aug 6, 2013
Sold by
Hurtgen Mark
Bought by
Federal National Mortgage Association
Purchase Details
Closed on
Jul 31, 2007
Sold by
Hurtgen Constance M
Bought by
Hurtgen Mark
Create a Home Valuation Report for This Property
The Home Valuation Report is an in-depth analysis detailing your home's value as well as a comparison with similar homes in the area
Home Values in the Area
Average Home Value in this Area
Purchase History
| Date | Buyer | Sale Price | Title Company |
|---|---|---|---|
| Knopik Haley J | $171,000 | Realstar Title | |
| Rivas Ana | -- | Trademark Title Services Inc | |
| Federal National Mortgage Association | -- | None Available | |
| Hurtgen Mark | $200,000 | -- |
Source: Public Records
Mortgage History
| Date | Status | Borrower | Loan Amount |
|---|---|---|---|
| Open | Knopik Haley J | $5,300 | |
| Open | Knopik Haley J | $167,902 | |
| Previous Owner | Rivas Ana | $123,226 |
Source: Public Records
Tax History Compared to Growth
Tax History
| Year | Tax Paid | Tax Assessment Tax Assessment Total Assessment is a certain percentage of the fair market value that is determined by local assessors to be the total taxable value of land and additions on the property. | Land | Improvement |
|---|---|---|---|---|
| 2024 | $3,584 | $269,600 | $75,100 | $194,500 |
| 2023 | $3,584 | $266,700 | $75,500 | $191,200 |
| 2022 | $2,938 | $260,000 | $75,500 | $184,500 |
| 2021 | $2,724 | $225,700 | $65,600 | $160,100 |
| 2020 | $3,126 | $207,700 | $62,500 | $145,200 |
| 2019 | $2,427 | $207,000 | $59,500 | $147,500 |
| 2018 | $2,377 | $185,100 | $54,100 | $131,000 |
| 2017 | $2,486 | $175,200 | $51,600 | $123,600 |
| 2016 | $2,320 | $156,700 | $46,900 | $109,800 |
| 2015 | $2,198 | $130,184 | $37,886 | $92,298 |
| 2014 | -- | $129,312 | $37,829 | $91,483 |
| 2013 | -- | $108,602 | $31,899 | $76,703 |
Source: Public Records
Map
Nearby Homes
- 601 Levander Way Unit 101
- 601 Levander Way Unit 208
- 921 17th Ave N
- 818 16th Ave N
- 522 16th Ave N
- 2205 Acorn Ln
- 1365 Christensen Ave
- 934 15th Ave N
- 436 17th Ave N
- 1044 17th Ave N
- 425 16th Ave N
- 606 13th Ave N
- 1439 Oakdale Ave
- 1010 Summit Ave
- 362 Trenton Ln
- 1518 Traverse Ln
- 358 Trenton Ln
- 1537 Traverse Ln
- 1541 Traverse Ln
- 364 Trenton Ln
- 738 21st Ave N
- 732 21st Ave N
- 744 21st Ave N
- 726 21st Ave N
- 750 21st Ave N
- 739 20th Ave N
- 733 20th Ave N
- 745 20th Ave N
- 751 751 21st Ave N
- 729 20th Ave N
- 720 21st Ave N
- 729 729 20th Ave N
- 751 751 20th Ave N
- 751 20th Ave N
- 739 21st Ave N
- 721 20th Ave N
- 758 758 21st Ave N
- 758 21st Ave N
- 733 21st Ave N
- 745 21st Ave N