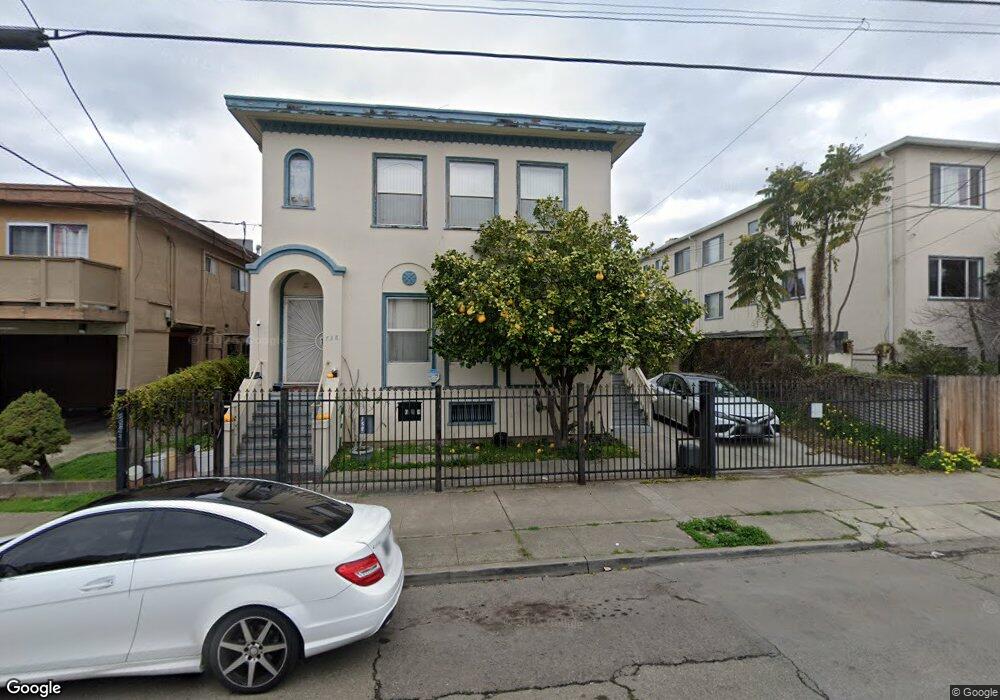
738 E 17th St Oakland, CA 94606
Clinton NeighborhoodEstimated Value: $902,000 - $1,123,000
7
Beds
4
Baths
2,732
Sq Ft
$360/Sq Ft
Est. Value
About This Home
This home is located at 738 E 17th St, Oakland, CA 94606 and is currently estimated at $983,325, approximately $359 per square foot. 738 E 17th St is a home located in Alameda County with nearby schools including Franklin Elementary School, Roosevelt Middle School, and Oakland High School.
Ownership History
Date
Name
Owned For
Owner Type
Purchase Details
Closed on
Jul 5, 2024
Sold by
Tran Diana Ma
Bought by
2024 Madao Family Revocable Trust and Van Tran
Current Estimated Value
Purchase Details
Closed on
Jan 22, 2010
Sold by
Tran Chuong
Bought by
Tran Diana M
Home Financials for this Owner
Home Financials are based on the most recent Mortgage that was taken out on this home.
Original Mortgage
$200,000
Interest Rate
4.91%
Mortgage Type
Purchase Money Mortgage
Purchase Details
Closed on
Dec 9, 2009
Sold by
U S Bank National Association
Bought by
Tran Diana Ma
Home Financials for this Owner
Home Financials are based on the most recent Mortgage that was taken out on this home.
Original Mortgage
$200,000
Interest Rate
4.91%
Mortgage Type
Purchase Money Mortgage
Purchase Details
Closed on
Jan 26, 2009
Sold by
Ma Chien
Bought by
U S Bank National Association
Purchase Details
Closed on
Dec 1, 2006
Sold by
Manguyen Denise
Bought by
Manguyen Vinny and Manguyen Denise
Purchase Details
Closed on
Jun 9, 2006
Sold by
Ma Chien
Bought by
Manguyen Denise
Purchase Details
Closed on
May 9, 2005
Sold by
Kwang Dagana Li
Bought by
Ma Chien
Home Financials for this Owner
Home Financials are based on the most recent Mortgage that was taken out on this home.
Original Mortgage
$420,000
Interest Rate
6.25%
Mortgage Type
Fannie Mae Freddie Mac
Purchase Details
Closed on
Jun 9, 2004
Sold by
Tran Luu Chi Lac and Tran Luu
Bought by
Vannguyen Quan
Home Financials for this Owner
Home Financials are based on the most recent Mortgage that was taken out on this home.
Original Mortgage
$336,000
Interest Rate
6.37%
Mortgage Type
Purchase Money Mortgage
Purchase Details
Closed on
Jun 8, 2004
Sold by
Chung Lan
Bought by
Vannguyen Quan
Home Financials for this Owner
Home Financials are based on the most recent Mortgage that was taken out on this home.
Original Mortgage
$336,000
Interest Rate
6.37%
Mortgage Type
Purchase Money Mortgage
Create a Home Valuation Report for This Property
The Home Valuation Report is an in-depth analysis detailing your home's value as well as a comparison with similar homes in the area
Home Values in the Area
Average Home Value in this Area
Purchase History
| Date | Buyer | Sale Price | Title Company |
|---|---|---|---|
| 2024 Madao Family Revocable Trust | -- | None Listed On Document | |
| Tran Diana M | -- | Lawyers Title Company | |
| Tran Diana Ma | $325,000 | Lawyers Title | |
| U S Bank National Association | $375,000 | None Available | |
| Manguyen Vinny | -- | None Available | |
| Manguyen Denise | -- | None Available | |
| Ma Chien | -- | Chicago Title Co | |
| Ma Chien | $600,000 | Chicago Title Co | |
| Vannguyen Quan | -- | Chicago Title Co | |
| Vannguyen Quan | $420,000 | First California Title Co | |
| Vannguyen Quan | -- | First California Title Co |
Source: Public Records
Mortgage History
| Date | Status | Borrower | Loan Amount |
|---|---|---|---|
| Previous Owner | Tran Diana Ma | $200,000 | |
| Previous Owner | Ma Chien | $420,000 | |
| Previous Owner | Vannguyen Quan | $336,000 | |
| Closed | Ma Chien | $150,000 |
Source: Public Records
Tax History
| Year | Tax Paid | Tax Assessment Tax Assessment Total Assessment is a certain percentage of the fair market value that is determined by local assessors to be the total taxable value of land and additions on the property. | Land | Improvement |
|---|---|---|---|---|
| 2025 | $7,538 | $419,487 | $125,846 | $293,641 |
| 2024 | $7,538 | $411,264 | $123,379 | $287,885 |
| 2023 | $7,819 | $403,201 | $120,960 | $282,241 |
| 2022 | $7,511 | $395,297 | $118,589 | $276,708 |
| 2021 | $7,049 | $387,548 | $116,264 | $271,284 |
| 2020 | $6,969 | $383,577 | $115,073 | $268,504 |
| 2019 | $6,623 | $376,057 | $112,817 | $263,240 |
| 2018 | $6,487 | $368,685 | $110,605 | $258,080 |
| 2017 | $6,205 | $361,457 | $108,437 | $253,020 |
| 2016 | $6,220 | $354,373 | $106,312 | $248,061 |
| 2015 | $5,935 | $349,052 | $104,715 | $244,337 |
| 2014 | $6,052 | $342,217 | $102,665 | $239,552 |
Source: Public Records
Map
Nearby Homes
- 842 E 17th St
- 812 E 19th St
- 836 E 19th St
- 635 E 15th St
- 1439 7th Ave
- 1532 5th Ave
- 1549 5th Ave
- 1444 9th Ave
- 415 Foothill Blvd
- 501 E 20th St
- 725 E 21st St
- 1431 5th Ave Unit 2
- 414 E 12th St
- 1005 E 12th St
- 1737 13th Ave
- 1155 International Blvd
- 220 International Blvd
- 726 E 23rd St
- 2306 Ivy Dr
- 1504 13th Ave
Your Personal Tour Guide
Ask me questions while you tour the home.