Estimated Value: $125,000 - $149,000
3
Beds
1
Bath
1,104
Sq Ft
$126/Sq Ft
Est. Value
About This Home
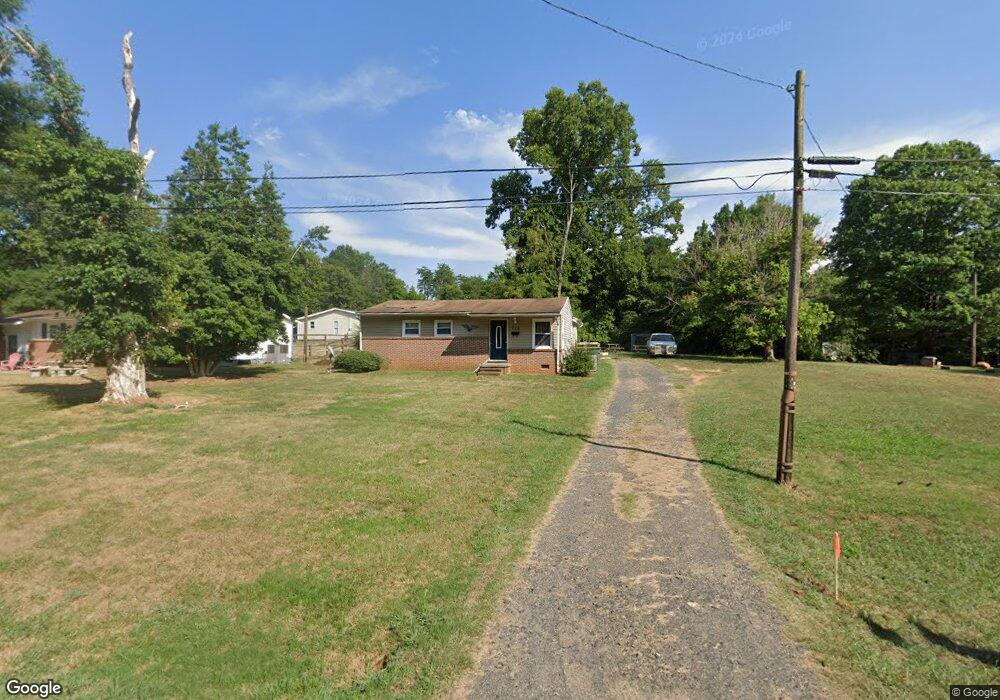
This home is located at 738 Friendly Rd, Eden, NC 27288 and is currently estimated at $139,279, approximately $126 per square foot. 738 Friendly Rd is a home located in Rockingham County with nearby schools including Central Elementary School, J.E. Holmes Middle School, and John M. Morehead High School.
Ownership History
Date
Name
Owned For
Owner Type
Purchase Details
Closed on
Jan 23, 2013
Sold by
Jpmorgan Chase Bank Na
Bought by
Foster Judy K
Current Estimated Value
Purchase Details
Closed on
Jul 23, 2012
Sold by
Johnson Dana L
Bought by
Jpmorgan Chase Bank National Association
Purchase Details
Closed on
Nov 24, 2009
Sold by
Rockingham Properties & Investments Llc
Bought by
Johnson Dana L
Home Financials for this Owner
Home Financials are based on the most recent Mortgage that was taken out on this home.
Original Mortgage
$42,857
Interest Rate
4.94%
Mortgage Type
New Conventional
Purchase Details
Closed on
Jun 26, 2009
Sold by
U S Bank National Association
Bought by
Rockingham Properties & Investments Llc
Purchase Details
Closed on
Jul 29, 2008
Sold by
Mccullough Michael and Mccullough Cheri
Bought by
Us Bank National Association
Create a Home Valuation Report for This Property
The Home Valuation Report is an in-depth analysis detailing your home's value as well as a comparison with similar homes in the area
Home Values in the Area
Average Home Value in this Area
Purchase History
| Date | Buyer | Sale Price | Title Company |
|---|---|---|---|
| Foster Judy K | $24,000 | None Available | |
| Jpmorgan Chase Bank National Association | $20,400 | None Available | |
| Johnson Dana L | $42,000 | None Available | |
| Rockingham Properties & Investments Llc | $22,000 | None Available | |
| Us Bank National Association | $62,761 | None Available |
Source: Public Records
Mortgage History
| Date | Status | Borrower | Loan Amount |
|---|---|---|---|
| Previous Owner | Johnson Dana L | $42,857 |
Source: Public Records
Tax History
| Year | Tax Paid | Tax Assessment Tax Assessment Total Assessment is a certain percentage of the fair market value that is determined by local assessors to be the total taxable value of land and additions on the property. | Land | Improvement |
|---|---|---|---|---|
| 2025 | $796 | $72,367 | $4,750 | $67,617 |
| 2024 | $796 | $72,367 | $4,750 | $67,617 |
| 2023 | $585 | $44,867 | $4,354 | $40,513 |
| 2022 | $585 | $44,867 | $4,354 | $40,513 |
| 2021 | $585 | $44,867 | $4,354 | $40,513 |
| 2020 | $585 | $44,867 | $4,354 | $40,513 |
| 2019 | $585 | $44,867 | $4,354 | $40,513 |
| 2018 | $737 | $56,488 | $9,334 | $47,154 |
| 2017 | $737 | $56,488 | $9,334 | $47,154 |
| 2015 | $745 | $56,488 | $9,334 | $47,154 |
| 2014 | -- | $56,488 | $9,334 | $47,154 |
Source: Public Records
Map
Nearby Homes
- 729 Cypress Hill Dr
- 621 North St
- 626 Creekridge Dr
- 401 Sherwood Ct
- 826 Summit Rd
- 183 E Aiken Rd
- 216 Roosevelt St
- 607 Truman St
- 00 Summit Rd
- 912 Friendly Rd
- 516 John St
- 737 Summit Rd
- 343 Pervie Bolick St
- 308 Walter Chambers St
- 802 E Warren Ave
- 328 Wilshire Dr
- 332 Wilshire Dr
- 334 Wilshire Dr
- 611 Riverside Dr
- 327 Wilshire Dr
- 744 Friendly Rd
- 732 Friendly Rd
- 739 Friendly Rd
- 739 Friendly Rd
- 745 Friendly Rd
- 730 Friendly Rd
- 1797 Friendly Rd
- 0 Friendly Rd
- 749 Friendly Rd
- 753 Friendly Rd
- 720 Friendly Rd
- 756 Friendly Rd
- 723 Friendly Rd
- 757 Friendly Rd
- 756 Pervie Bolick St
- 700 Friendly Rd
- 743 Pervie Bolick St
- 730 Cypress Hill Dr
- 726 Cypress Hill Dr
- 0 Cypress Hill Dr
Your Personal Tour Guide
Ask me questions while you tour the home.