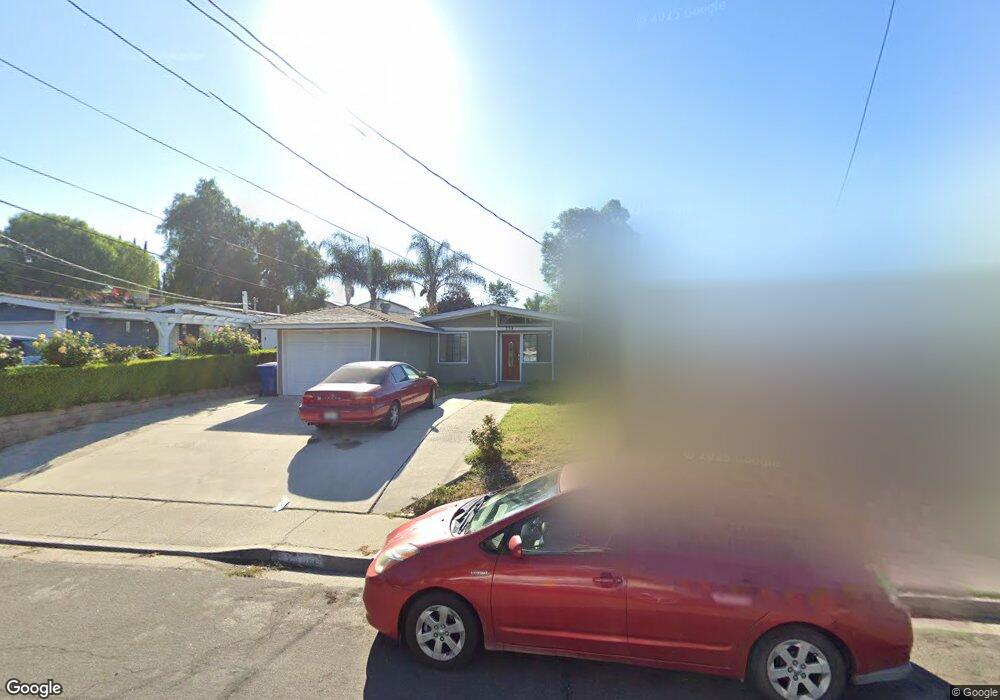
738 Glen Oaks Rd Thousand Oaks, CA 91360
Estimated Value: $761,000 - $879,000
3
Beds
2
Baths
1,416
Sq Ft
$565/Sq Ft
Est. Value
About This Home
This home is located at 738 Glen Oaks Rd, Thousand Oaks, CA 91360 and is currently estimated at $800,332, approximately $565 per square foot. 738 Glen Oaks Rd is a home located in Ventura County with nearby schools including Glenwood Elementary School, Colina Middle School, and Westlake High School.
Ownership History
Date
Name
Owned For
Owner Type
Purchase Details
Closed on
Jan 8, 2013
Sold by
Haggard Dennis W and Haggard Sandra L
Bought by
Colfin Ai-Ca 5 Llc
Current Estimated Value
Purchase Details
Closed on
Sep 15, 2000
Sold by
Thomas Koch
Bought by
Haggard Dennis W and Haggard Sandra L
Home Financials for this Owner
Home Financials are based on the most recent Mortgage that was taken out on this home.
Original Mortgage
$198,000
Interest Rate
8.01%
Purchase Details
Closed on
Jun 13, 2000
Sold by
Thomas Koch
Bought by
Koch Thomas David and Koch Linda Lee
Purchase Details
Closed on
Jan 6, 1999
Sold by
Thomas Koch
Bought by
Koch Tom and Koch Linda
Home Financials for this Owner
Home Financials are based on the most recent Mortgage that was taken out on this home.
Original Mortgage
$148,750
Interest Rate
6.73%
Create a Home Valuation Report for This Property
The Home Valuation Report is an in-depth analysis detailing your home's value as well as a comparison with similar homes in the area
Home Values in the Area
Average Home Value in this Area
Purchase History
| Date | Buyer | Sale Price | Title Company |
|---|---|---|---|
| Colfin Ai-Ca 5 Llc | $277,500 | None Available | |
| Haggard Dennis W | $220,000 | Chicago Title Co | |
| Koch Thomas David | -- | -- | |
| Koch Tom | -- | Stewart Title |
Source: Public Records
Mortgage History
| Date | Status | Borrower | Loan Amount |
|---|---|---|---|
| Previous Owner | Haggard Dennis W | $198,000 | |
| Previous Owner | Koch Tom | $148,750 |
Source: Public Records
Tax History Compared to Growth
Tax History
| Year | Tax Paid | Tax Assessment Tax Assessment Total Assessment is a certain percentage of the fair market value that is determined by local assessors to be the total taxable value of land and additions on the property. | Land | Improvement |
|---|---|---|---|---|
| 2025 | $6,329 | $564,929 | $366,950 | $197,979 |
| 2024 | $6,329 | $553,852 | $359,754 | $194,098 |
| 2023 | $6,140 | $542,993 | $352,700 | $190,293 |
| 2022 | $6,032 | $532,347 | $345,785 | $186,562 |
| 2021 | $6,020 | $530,416 | $344,497 | $185,919 |
| 2020 | $5,588 | $524,978 | $340,965 | $184,013 |
| 2019 | $5,441 | $514,685 | $334,280 | $180,405 |
| 2018 | $5,333 | $504,594 | $327,726 | $176,868 |
| 2017 | $3,771 | $354,383 | $263,136 | $91,247 |
| 2016 | $3,737 | $347,435 | $257,977 | $89,458 |
| 2015 | $3,672 | $342,217 | $254,102 | $88,115 |
| 2014 | $3,620 | $335,515 | $249,125 | $86,390 |
Source: Public Records
Map
Nearby Homes
- 163 Houston Dr
- 245 Houston Dr
- 647 Brossard Dr
- 978 Bower Way
- 1000 E Thousand Oaks Blvd
- 1340 E Hillcrest Dr Unit 8
- 1342 E Hillcrest Dr Unit 20
- 566 Rancho Rd
- 331 Dryden St
- 110 Maegan Place Unit 13
- 68 Maegan Place Unit 7
- 62 Maegan Place Unit 4
- 1248 La Peresa Dr
- 918 Rancho Rd
- 86 Maegan Place Unit 4
- 56 Maegan Place Unit 4
- 1649 Hauser Cir
- 1710 E Thousand Oaks Blvd
- 1116 Rexford Place
- 932 Rosario Dr
- 746 Glen Oaks Rd
- 730 Glen Oaks Rd
- 752 Glen Oaks Rd
- 724 Glen Oaks Rd
- 758 Glen Oaks Rd
- 716 Glen Oaks Rd
- 221 Houston Dr
- 803 Vinton Ct
- 710 Glen Oaks Rd
- 217 Houston Dr
- 213 Houston Dr
- 205 Houston Dr
- 209 Houston Dr
- 702 Glen Oaks Rd
- 229 Houston Dr
- 743 E Hillcrest Dr
- 713 Glen Oaks Rd
- 721 Glen Oaks Rd
- 765 E Hillcrest Dr
- 729 Glen Oaks Rd