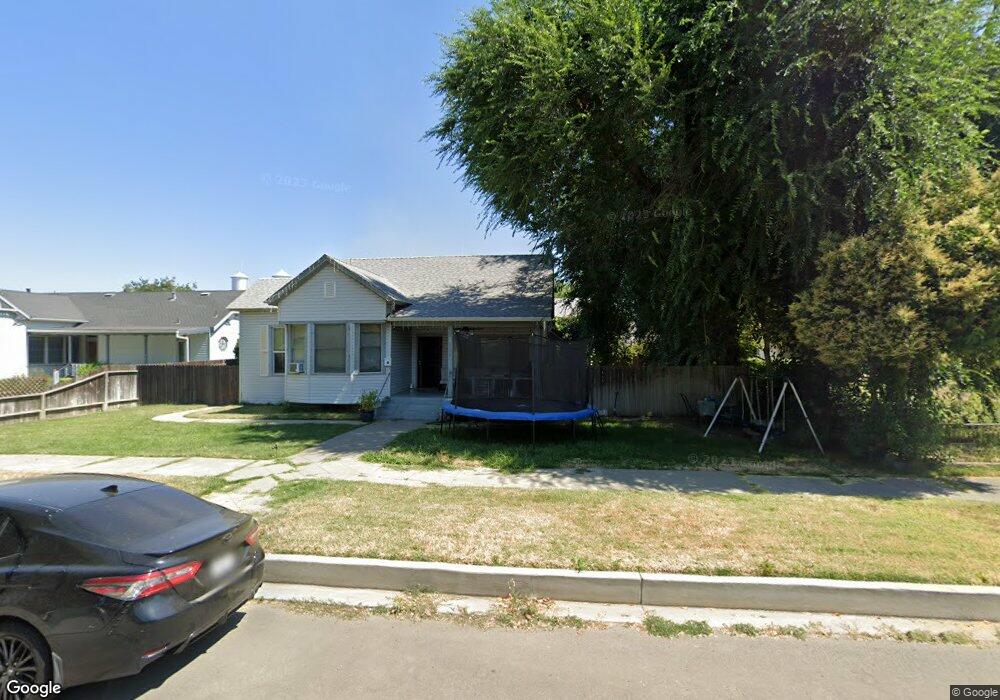
738 Jay St Colusa, CA 95932
Estimated Value: $343,000 - $390,770
3
Beds
2
Baths
1,658
Sq Ft
$222/Sq Ft
Est. Value
About This Home
This home is located at 738 Jay St, Colusa, CA 95932 and is currently estimated at $368,443, approximately $222 per square foot. 738 Jay St is a home with nearby schools including James M. Burchfield Primary School, George T. Egling Middle School, and Colusa High School.
Ownership History
Date
Name
Owned For
Owner Type
Purchase Details
Closed on
Sep 5, 2018
Sold by
The Messick Partnership
Bought by
Reische Thomas P and Reische Sharon K
Current Estimated Value
Home Financials for this Owner
Home Financials are based on the most recent Mortgage that was taken out on this home.
Original Mortgage
$215,000
Outstanding Balance
$187,510
Interest Rate
4.6%
Mortgage Type
Purchase Money Mortgage
Estimated Equity
$180,933
Purchase Details
Closed on
Sep 1, 2005
Sold by
Messick Jack N Critchfield and Messick Harold Kirk
Bought by
Messick Partnership
Create a Home Valuation Report for This Property
The Home Valuation Report is an in-depth analysis detailing your home's value as well as a comparison with similar homes in the area
Home Values in the Area
Average Home Value in this Area
Purchase History
| Date | Buyer | Sale Price | Title Company |
|---|---|---|---|
| Reische Thomas P | $225,000 | First American Title Co | |
| Messick Partnership | -- | -- |
Source: Public Records
Mortgage History
| Date | Status | Borrower | Loan Amount |
|---|---|---|---|
| Open | Reische Thomas P | $215,000 |
Source: Public Records
Tax History Compared to Growth
Tax History
| Year | Tax Paid | Tax Assessment Tax Assessment Total Assessment is a certain percentage of the fair market value that is determined by local assessors to be the total taxable value of land and additions on the property. | Land | Improvement |
|---|---|---|---|---|
| 2025 | $2,778 | $250,988 | $50,196 | $200,792 |
| 2024 | $2,778 | $246,067 | $49,212 | $196,855 |
| 2023 | $2,661 | $241,244 | $48,248 | $192,996 |
| 2022 | $2,659 | $236,514 | $47,302 | $189,212 |
| 2021 | $2,547 | $231,877 | $46,375 | $185,502 |
| 2020 | $2,518 | $229,500 | $45,900 | $183,600 |
| 2019 | $2,460 | $225,000 | $45,000 | $180,000 |
| 2018 | $864 | $69,231 | $10,726 | $58,505 |
| 2017 | $859 | $67,874 | $10,516 | $57,358 |
| 2016 | $839 | $66,544 | $10,310 | $56,234 |
| 2015 | $824 | $65,546 | $10,156 | $55,390 |
| 2014 | $789 | $64,263 | $9,958 | $54,305 |
Source: Public Records
Map
Nearby Homes