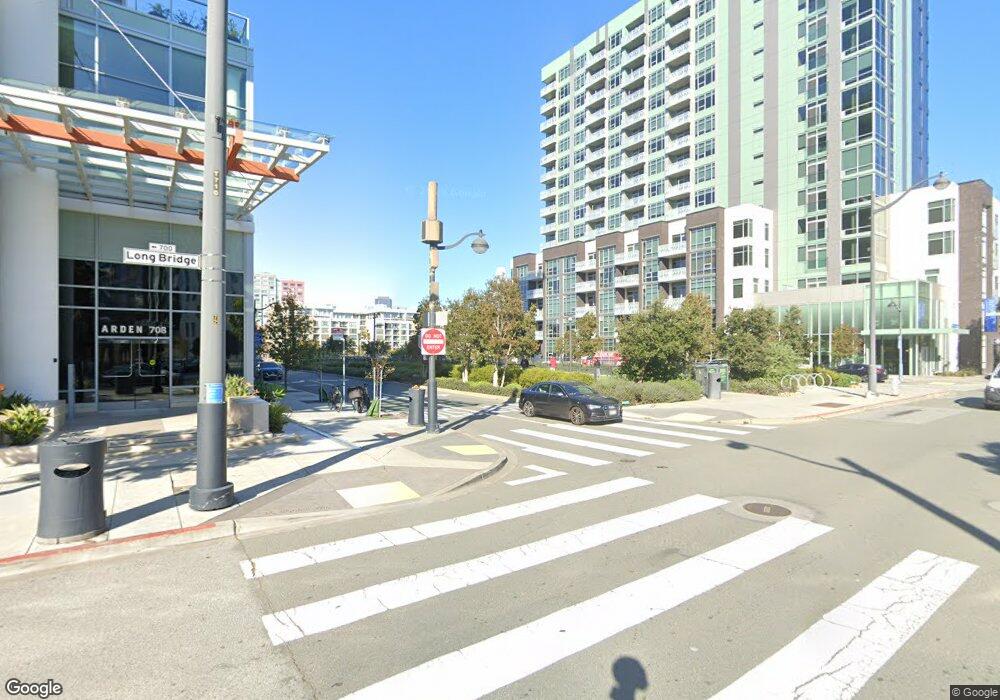
738 Long Bridge St Unit 715 San Francisco, CA 94158
Mission Bay NeighborhoodEstimated Value: $1,646,000 - $1,924,000
2
Beds
2
Baths
1,244
Sq Ft
$1,390/Sq Ft
Est. Value
About This Home
This home is located at 738 Long Bridge St Unit 715, San Francisco, CA 94158 and is currently estimated at $1,729,146, approximately $1,389 per square foot. 738 Long Bridge St Unit 715 is a home located in San Francisco County with nearby schools including Daniel Webster Elementary School, James Lick Middle School, and The New School of San Francisco.
Ownership History
Date
Name
Owned For
Owner Type
Purchase Details
Closed on
Nov 14, 2019
Sold by
Min Eric Hojoon and Kim Ji Hyun
Bought by
Alden Andrew and Kuo Ilin
Current Estimated Value
Home Financials for this Owner
Home Financials are based on the most recent Mortgage that was taken out on this home.
Original Mortgage
$1,547,800
Outstanding Balance
$1,344,890
Interest Rate
3%
Mortgage Type
New Conventional
Estimated Equity
$384,256
Purchase Details
Closed on
Jun 16, 2016
Sold by
Chien Franklyn
Bought by
Min Eric Hojoon and Kim Ji Hyun
Home Financials for this Owner
Home Financials are based on the most recent Mortgage that was taken out on this home.
Original Mortgage
$1,240,000
Interest Rate
2.75%
Mortgage Type
Adjustable Rate Mortgage/ARM
Purchase Details
Closed on
Nov 9, 2015
Sold by
Bosa Development California Ii Inc
Bought by
Chien Franklyn
Create a Home Valuation Report for This Property
The Home Valuation Report is an in-depth analysis detailing your home's value as well as a comparison with similar homes in the area
Home Values in the Area
Average Home Value in this Area
Purchase History
| Date | Buyer | Sale Price | Title Company |
|---|---|---|---|
| Alden Andrew | $1,720,000 | Old Republic Title Company | |
| Min Eric Hojoon | $1,550,000 | Old Republic Title Company | |
| Chien Franklyn | $1,290,000 | First American Title Company |
Source: Public Records
Mortgage History
| Date | Status | Borrower | Loan Amount |
|---|---|---|---|
| Open | Alden Andrew | $1,547,800 | |
| Previous Owner | Min Eric Hojoon | $1,240,000 |
Source: Public Records
Tax History Compared to Growth
Tax History
| Year | Tax Paid | Tax Assessment Tax Assessment Total Assessment is a certain percentage of the fair market value that is determined by local assessors to be the total taxable value of land and additions on the property. | Land | Improvement |
|---|---|---|---|---|
| 2025 | $23,763 | $1,881,066 | $1,128,640 | $752,426 |
| 2024 | $23,763 | $1,844,183 | $1,106,510 | $737,673 |
| 2023 | $23,385 | $1,808,023 | $1,084,814 | $723,209 |
| 2022 | $22,943 | $1,772,573 | $1,063,544 | $709,029 |
| 2021 | $22,531 | $1,737,818 | $1,042,691 | $695,127 |
| 2020 | $22,595 | $1,720,000 | $1,032,000 | $688,000 |
| 2019 | $21,266 | $1,644,872 | $822,436 | $822,436 |
| 2018 | $20,645 | $1,612,620 | $806,310 | $806,310 |
| 2017 | $20,092 | $1,581,000 | $790,500 | $790,500 |
| 2016 | $16,432 | $1,947,461 | $645,000 | $1,302,461 |
Source: Public Records
Map
Nearby Homes
- 708 Long Bridge St Unit 917
- 325 Berry St Unit 715
- 325 Berry St Unit 325
- 300 Berry St Unit 914
- 110 Channel St Unit 104
- 435 China Basin St Unit 205
- 1000 3rd St Unit 902
- 325 China Basin St Unit 416
- 325 China Basin St Unit 312
- 330 Mission Bay Blvd N Unit 605
- 260 King St Unit 261
- 260 King St Unit 909
- 260 King St Unit 529
- 260 King St Unit 683
- 260 King St Unit 1107
- 260 King St Unit 631
- 260 King St Unit 741
- 655 5th St Unit 8
- 207 King St Unit 402
- 1 Bluxome St Unit 317
- 738 Long Bridge St Unit 1408
- 738 Long Bridge St Unit 204
- 738 Long Bridge St Unit 1210
- 738 Long Bridge St
- 738 Long Bridge St Unit 915
- 738 Long Bridge St Unit 510
- 738 Long Bridge St Unit 814
- 738 Long Bridge St Unit 1606
- 738 Long Bridge St Unit 311
- 738 Long Bridge St Unit 911
- 738 Long Bridge St Unit 1411
- 738 Long Bridge St Unit 716
- 738 Long Bridge St Unit 109
- 738 Long Bridge St Unit 107
- 738 Long Bridge St Unit 213
- 738 Long Bridge St Unit 110
- 738 Long Bridge St Unit 806
- 738 Long Bridge St Unit 407
- 738 Long Bridge St Unit 1501
- 738 Long Bridge St Unit 616