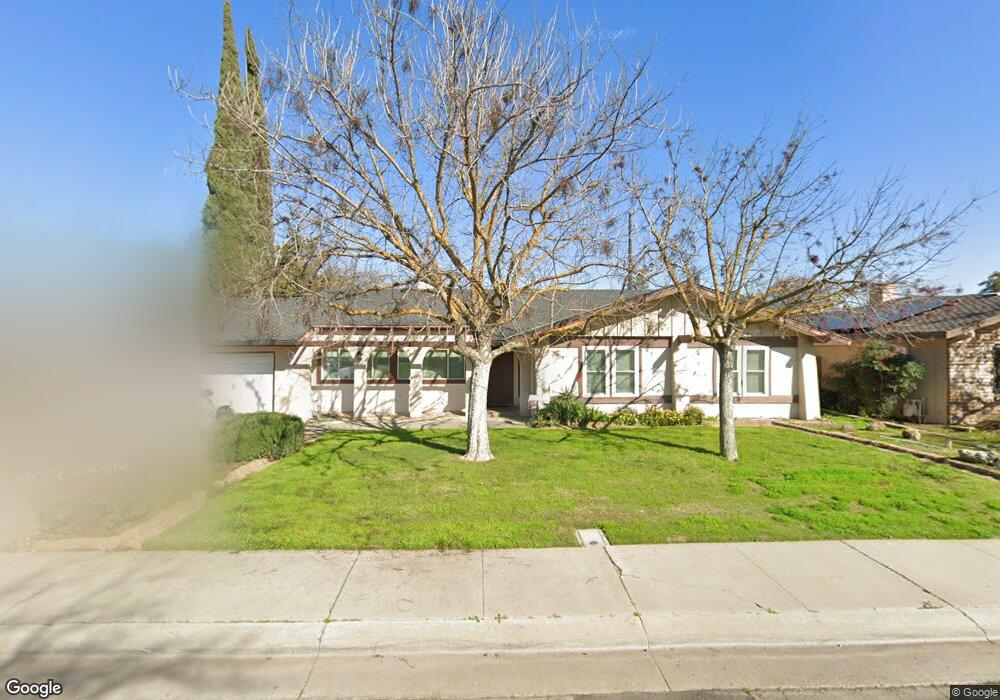
738 Page Ave Los Banos, CA 93635
Estimated Value: $443,000 - $590,000
3
Beds
2
Baths
1,994
Sq Ft
$265/Sq Ft
Est. Value
About This Home
This home is located at 738 Page Ave, Los Banos, CA 93635 and is currently estimated at $529,134, approximately $265 per square foot. 738 Page Ave is a home located in Merced County with nearby schools including Los Banos Elementary School, Creekside Junior High School, and Los Banos High School.
Ownership History
Date
Name
Owned For
Owner Type
Purchase Details
Closed on
Jun 10, 2005
Sold by
Sydow Robert B and Sydow Jean L
Bought by
Bohr Steve J and Bohr Helen R
Current Estimated Value
Home Financials for this Owner
Home Financials are based on the most recent Mortgage that was taken out on this home.
Original Mortgage
$349,520
Outstanding Balance
$180,352
Interest Rate
5.58%
Mortgage Type
Fannie Mae Freddie Mac
Estimated Equity
$348,782
Create a Home Valuation Report for This Property
The Home Valuation Report is an in-depth analysis detailing your home's value as well as a comparison with similar homes in the area
Home Values in the Area
Average Home Value in this Area
Purchase History
| Date | Buyer | Sale Price | Title Company |
|---|---|---|---|
| Bohr Steve J | $437,000 | Transcounty Title Company |
Source: Public Records
Mortgage History
| Date | Status | Borrower | Loan Amount |
|---|---|---|---|
| Open | Bohr Steve J | $349,520 |
Source: Public Records
Tax History Compared to Growth
Tax History
| Year | Tax Paid | Tax Assessment Tax Assessment Total Assessment is a certain percentage of the fair market value that is determined by local assessors to be the total taxable value of land and additions on the property. | Land | Improvement |
|---|---|---|---|---|
| 2025 | $5,607 | $505,000 | $140,000 | $365,000 |
| 2024 | $5,607 | $505,000 | $130,000 | $375,000 |
| 2023 | $5,195 | $486,000 | $110,000 | $376,000 |
| 2022 | $5,376 | $500,000 | $110,000 | $390,000 |
| 2021 | $4,668 | $430,500 | $95,000 | $335,500 |
| 2020 | $4,221 | $390,000 | $95,000 | $295,000 |
| 2019 | $4,366 | $402,500 | $85,000 | $317,500 |
| 2018 | $4,008 | $373,500 | $85,000 | $288,500 |
| 2017 | $3,572 | $331,000 | $60,000 | $271,000 |
| 2016 | $3,050 | $275,000 | $55,000 | $220,000 |
| 2015 | $2,660 | $242,000 | $60,000 | $182,000 |
| 2014 | $2,057 | $190,000 | $30,000 | $160,000 |
Source: Public Records
Map
Nearby Homes