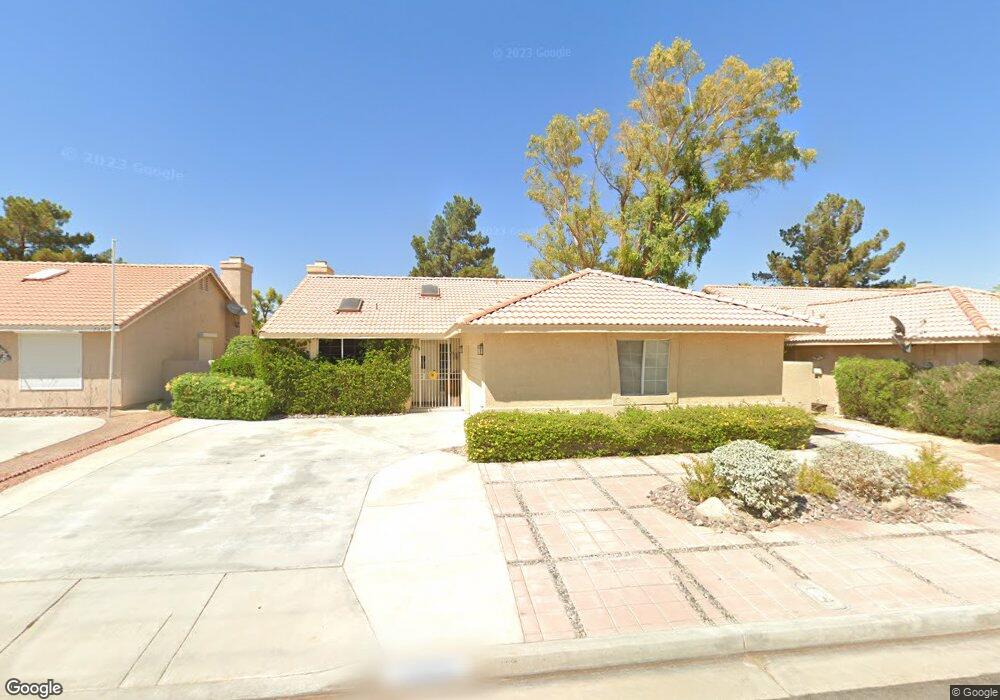
73806 White Sands Dr Thousand Palms, CA 92276
Estimated Value: $358,000 - $420,000
3
Beds
2
Baths
1,507
Sq Ft
$261/Sq Ft
Est. Value
About This Home
This home is located at 73806 White Sands Dr, Thousand Palms, CA 92276 and is currently estimated at $393,451, approximately $261 per square foot. 73806 White Sands Dr is a home located in Riverside County with nearby schools including Della S. Lindley Elementary School, Nellie N. Coffman Middle School, and Rancho Mirage High.
Ownership History
Date
Name
Owned For
Owner Type
Purchase Details
Closed on
Jul 25, 2023
Sold by
Caffrey Patricia
Bought by
Patricia E Caffrey Revocable Living Trust and Caffrey
Current Estimated Value
Purchase Details
Closed on
Nov 29, 2004
Sold by
Vasquez Alexander C and Vasquez Margaret A
Bought by
Caffrey Patricia
Home Financials for this Owner
Home Financials are based on the most recent Mortgage that was taken out on this home.
Original Mortgage
$160,000
Interest Rate
4.87%
Mortgage Type
Purchase Money Mortgage
Purchase Details
Closed on
May 14, 1999
Sold by
Conklin and Genevieve
Bought by
Vasquez Alexander C and Vasquez Margaret A
Purchase Details
Closed on
Dec 13, 1994
Sold by
Conklin Newman and Conklin Genevieve
Bought by
Conklin Newman and Conklin Genevieve
Purchase Details
Closed on
Apr 26, 1994
Sold by
Farmers & Merchants Bank Of Long Beach
Bought by
Conklin Newman B and Conklin Genevieve I
Create a Home Valuation Report for This Property
The Home Valuation Report is an in-depth analysis detailing your home's value as well as a comparison with similar homes in the area
Home Values in the Area
Average Home Value in this Area
Purchase History
| Date | Buyer | Sale Price | Title Company |
|---|---|---|---|
| Patricia E Caffrey Revocable Living Trust | -- | None Listed On Document | |
| Caffrey Patricia | -- | Chicago Title Co | |
| Vasquez Alexander C | $145,000 | First American Title Co | |
| Conklin Newman | -- | Transamerica Title Ins Co | |
| Conklin Newman B | $109,000 | Fidelity National Title |
Source: Public Records
Mortgage History
| Date | Status | Borrower | Loan Amount |
|---|---|---|---|
| Previous Owner | Caffrey Patricia | $160,000 |
Source: Public Records
Tax History Compared to Growth
Tax History
| Year | Tax Paid | Tax Assessment Tax Assessment Total Assessment is a certain percentage of the fair market value that is determined by local assessors to be the total taxable value of land and additions on the property. | Land | Improvement |
|---|---|---|---|---|
| 2025 | $5,346 | $407,880 | $97,560 | $310,320 |
| 2023 | $5,346 | $373,348 | $84,409 | $288,939 |
| 2022 | $4,724 | $339,408 | $76,736 | $262,672 |
| 2021 | $3,866 | $275,941 | $62,387 | $213,554 |
| 2020 | $3,345 | $246,376 | $55,702 | $190,674 |
| 2019 | $3,259 | $239,200 | $54,080 | $185,120 |
| 2018 | $3,143 | $230,000 | $52,000 | $178,000 |
| 2017 | $2,995 | $216,000 | $49,000 | $167,000 |
| 2016 | $2,971 | $215,000 | $49,000 | $166,000 |
| 2015 | $2,909 | $215,000 | $49,000 | $166,000 |
| 2014 | $2,644 | $191,000 | $43,000 | $148,000 |
Source: Public Records
Map
Nearby Homes
- 73816 White Sands Dr
- 33854 Palm Lake Cir
- 73751 White Sands Dr
- 73810 Boca Chica Trail
- 33681 Les Rd
- 34314 Thomas Ct
- 33660 Les Rd
- 33878 Drifting Sands Cir
- 73821 Elizabeth Dr
- 33570 Walton Cir
- 33560 Les Rd
- 33530 Acapulco Trail
- 73991 Boca Chica Trail
- 33537 Lisa Cir
- 33577 Laura Dr
- 33265 Laura Dr
- 33310 Barcelona Dr
- 33423 Barcelona Dr
- 33411 San Lucas Trail
- 0 Nwc Dinah Shore Dr & Spyder CI
- 73796 White Sands Dr
- 73786 White Sands Dr
- 73826 White Sands Dr
- 73811 White Sands Dr
- 73801 White Sands Dr
- 73821 White Sands Dr
- 73791 White Sands Dr
- 73776 White Sands Dr
- 73781 White Sands Dr
- 73831 White Sands Dr
- 33919 Palm Lake Cir
- 33899 Palm Lake Cir
- 73766 White Sands Dr
- 33939 Palm Lake Cir
- 33879 Palm Lake Cir
- 73771 White Sands Dr
- 73841 White Sands Dr
- 33859 Palm Lake Cir
- 73756 White Sands Dr
- 73851 White Sands Dr